logo-mini

Power BI Showcase

Business intelligence (BI) solutions are designed to help businesses make informed decisions by providing them with data insights and analysis. One such BI solution is Power BI, developed by Microsoft. Power BI is a cloud-based platform that allows businesses to connect to, analyze, and visualize data from various sources, including spreadsheets, databases, and cloud applications.

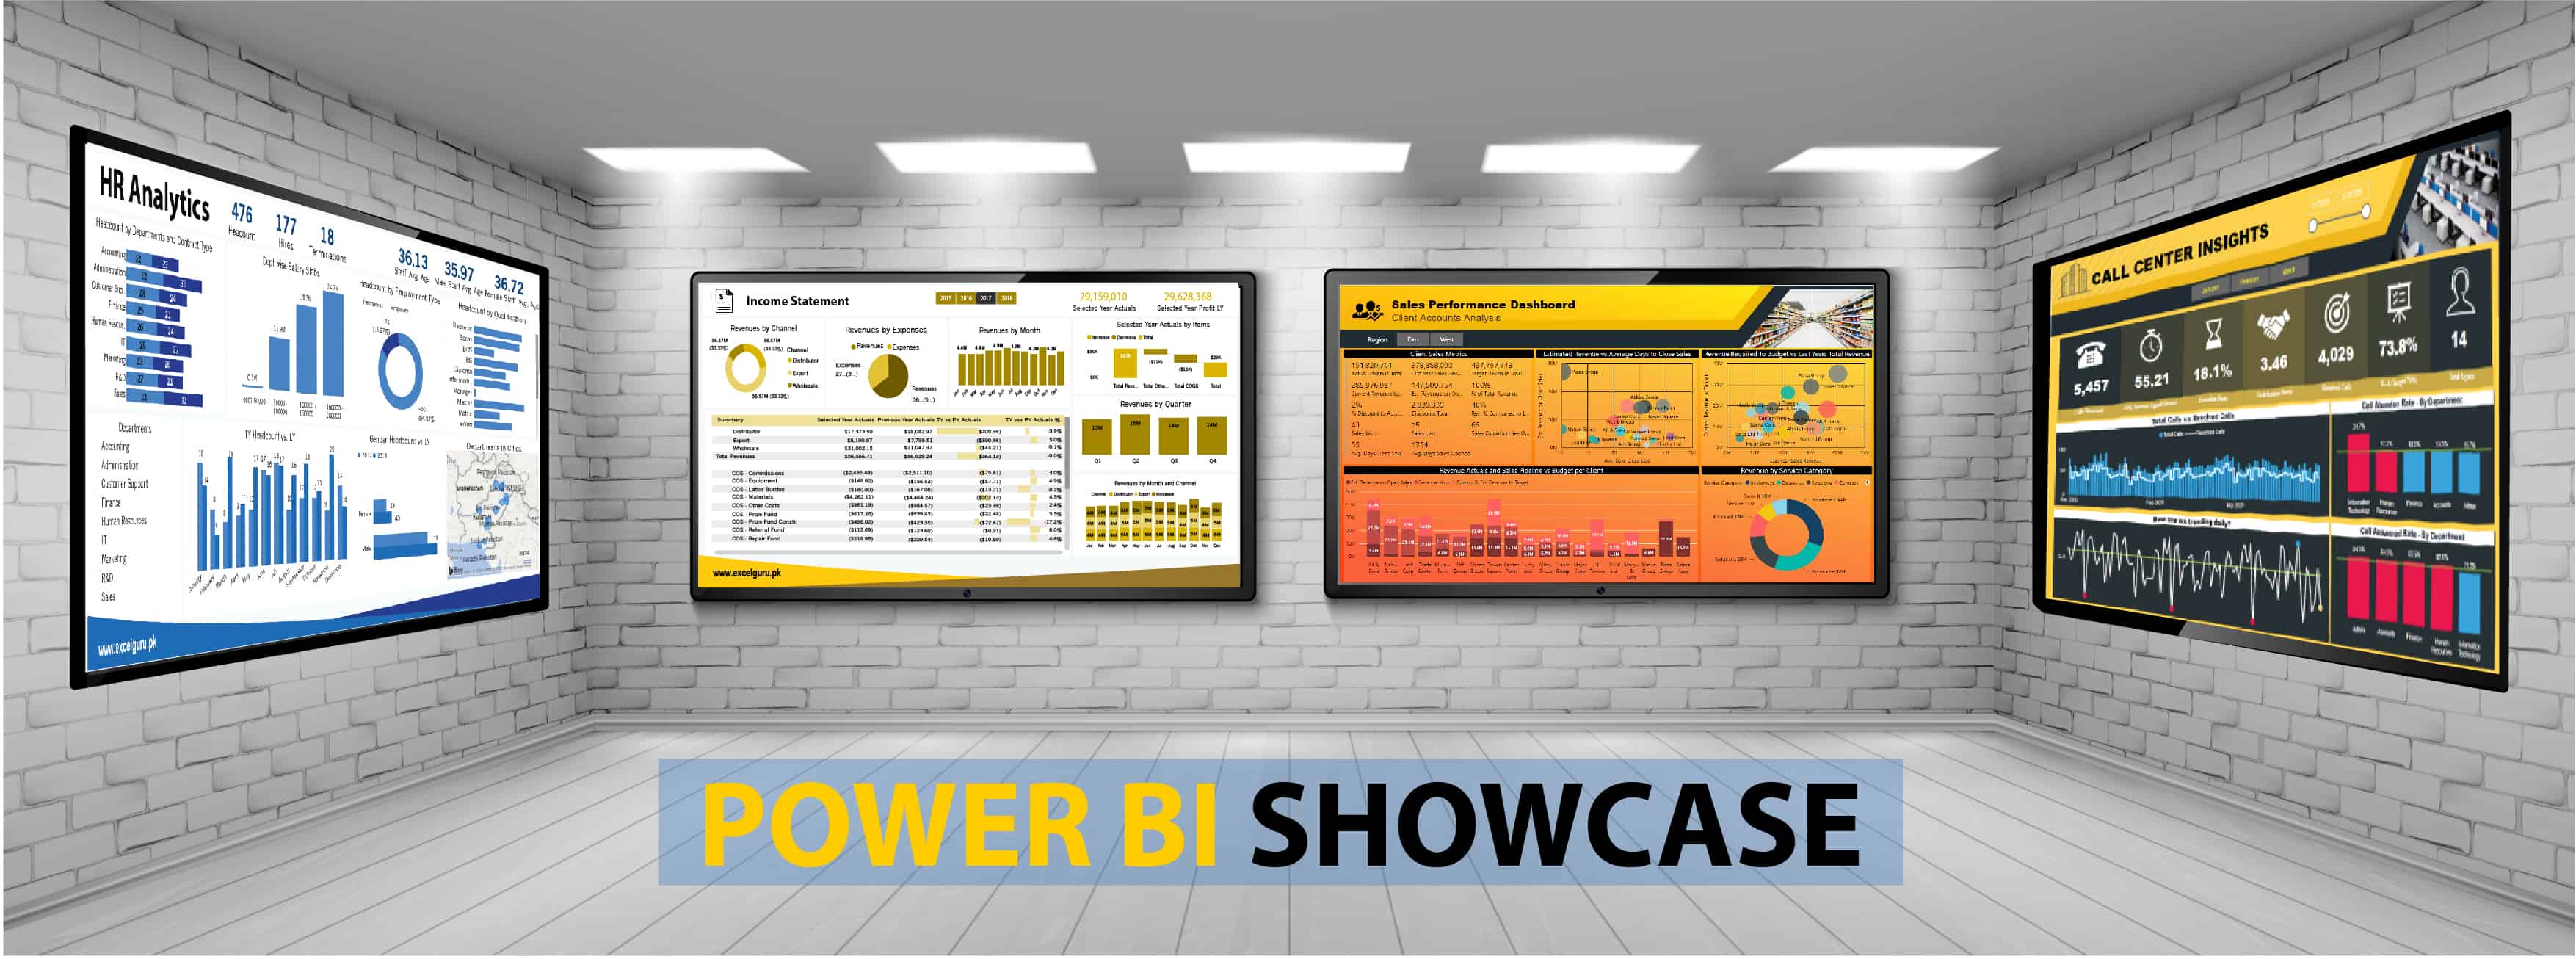
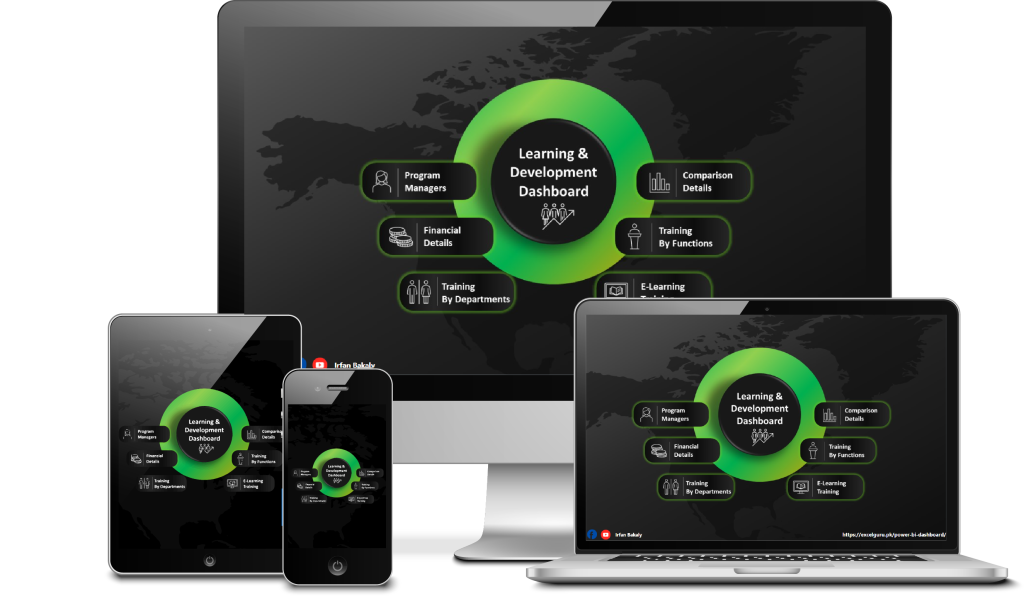
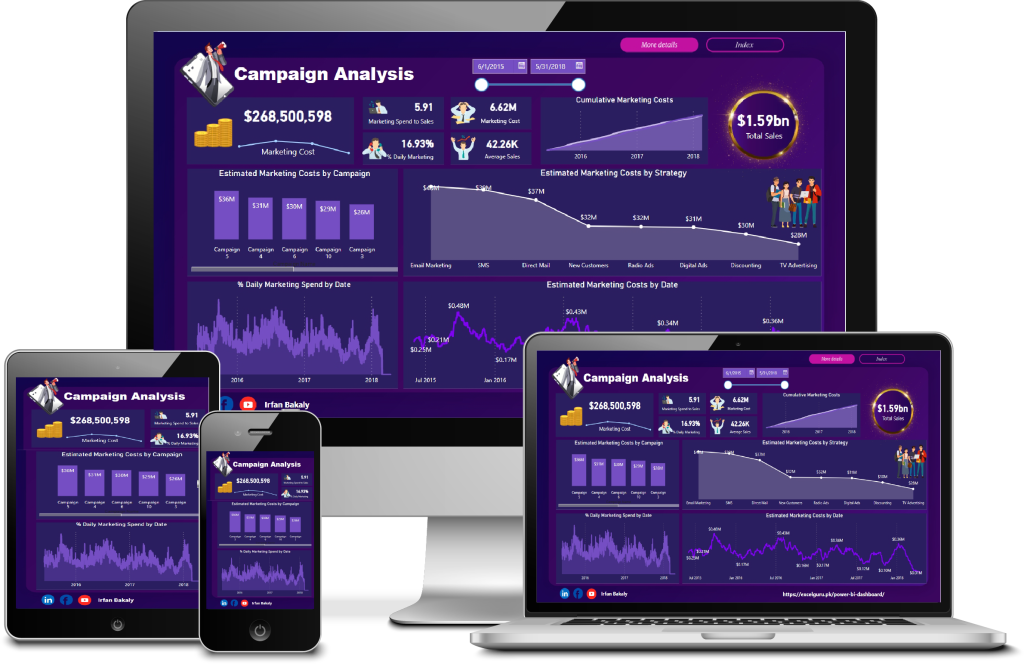
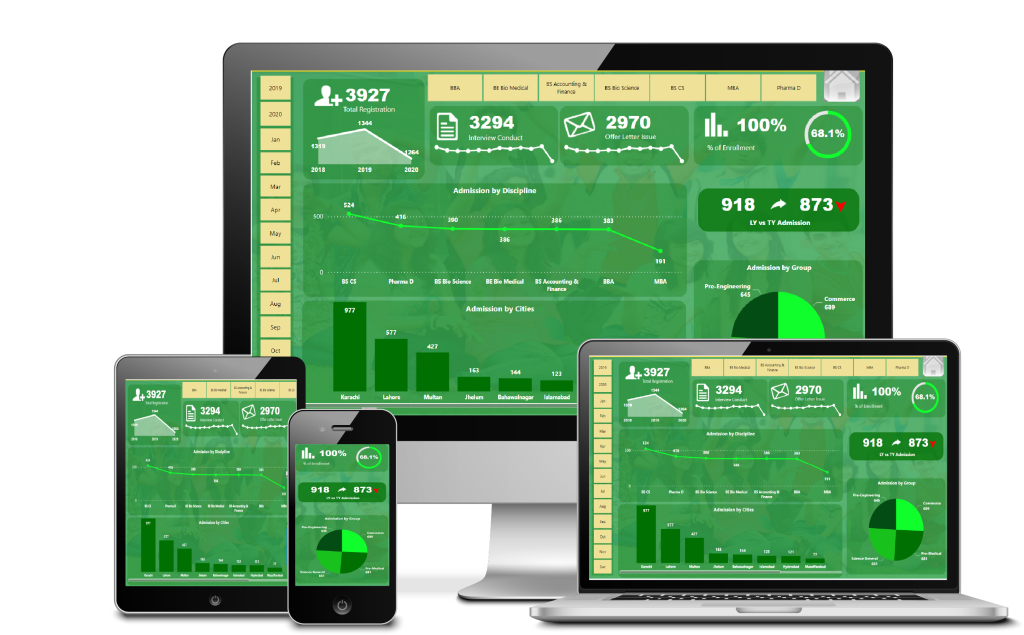
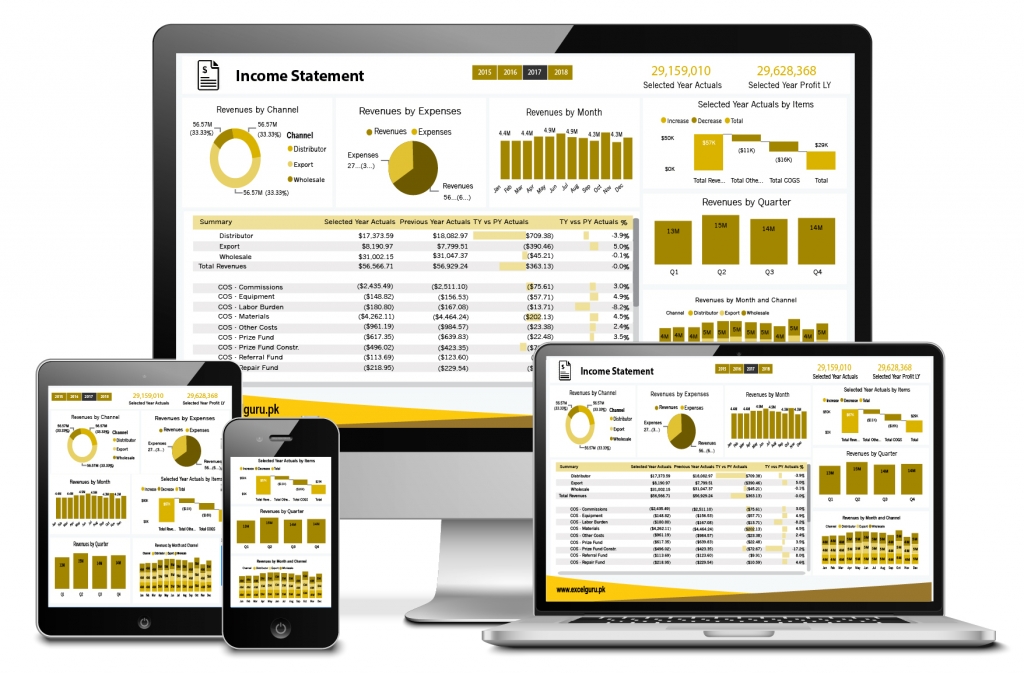
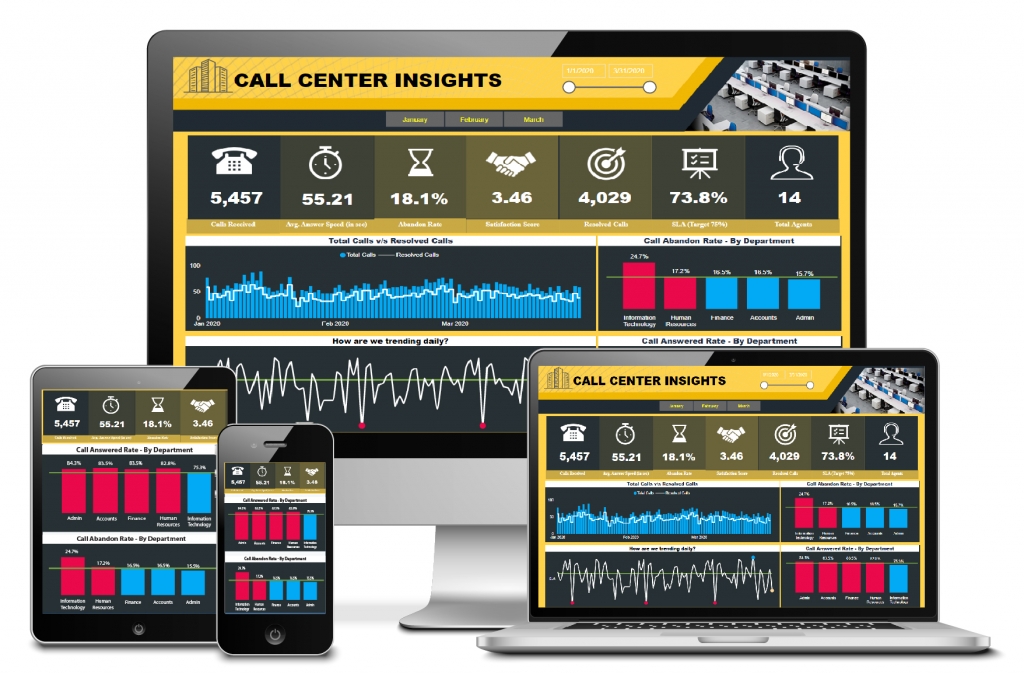
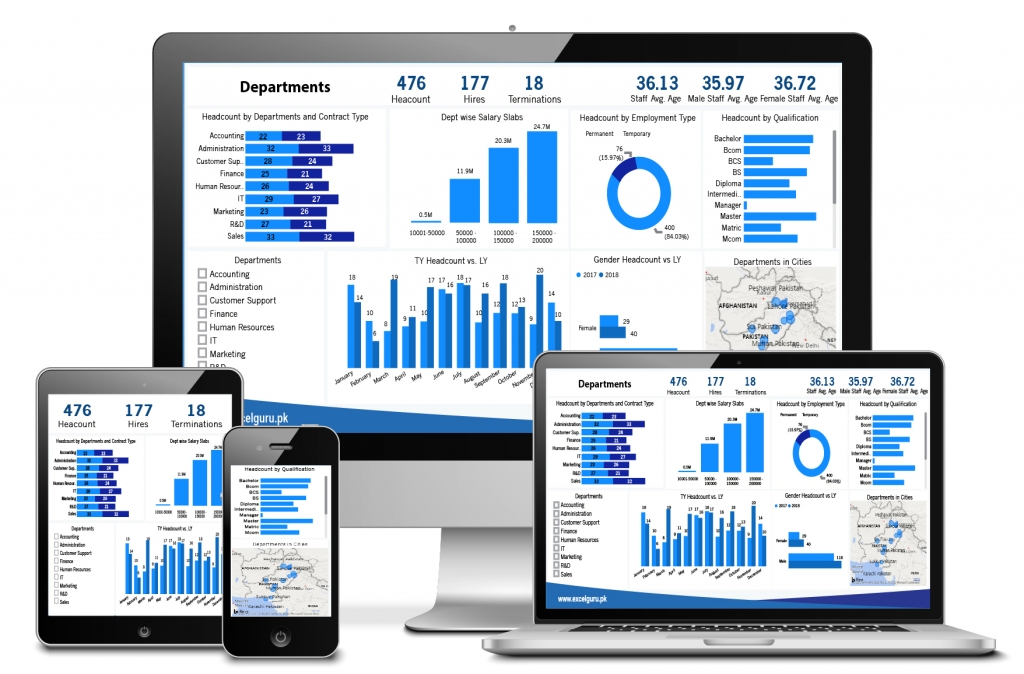
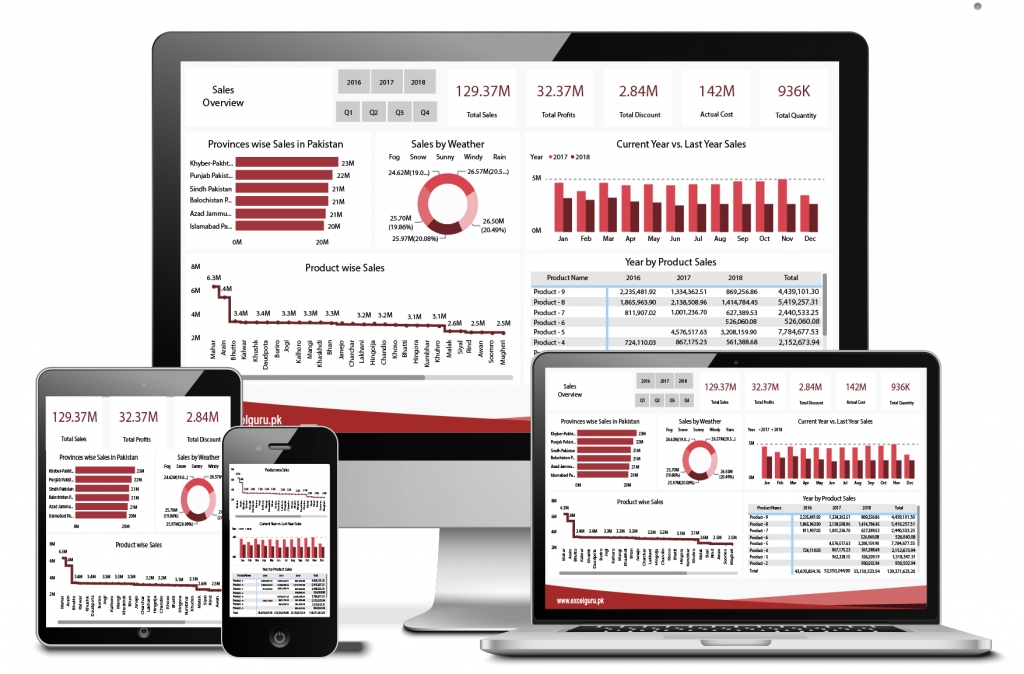
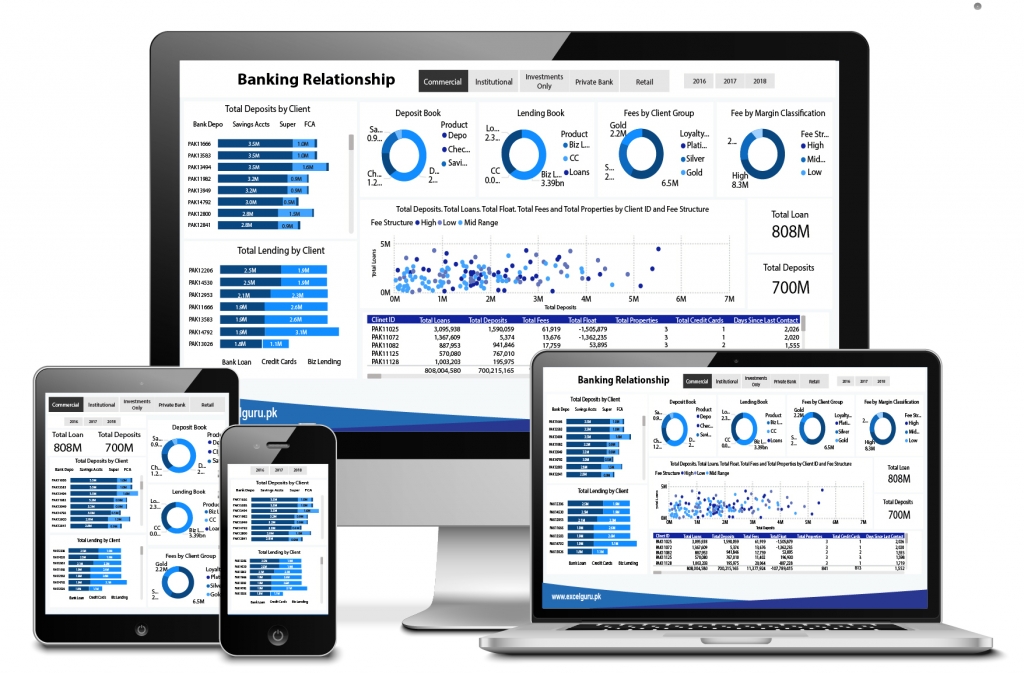
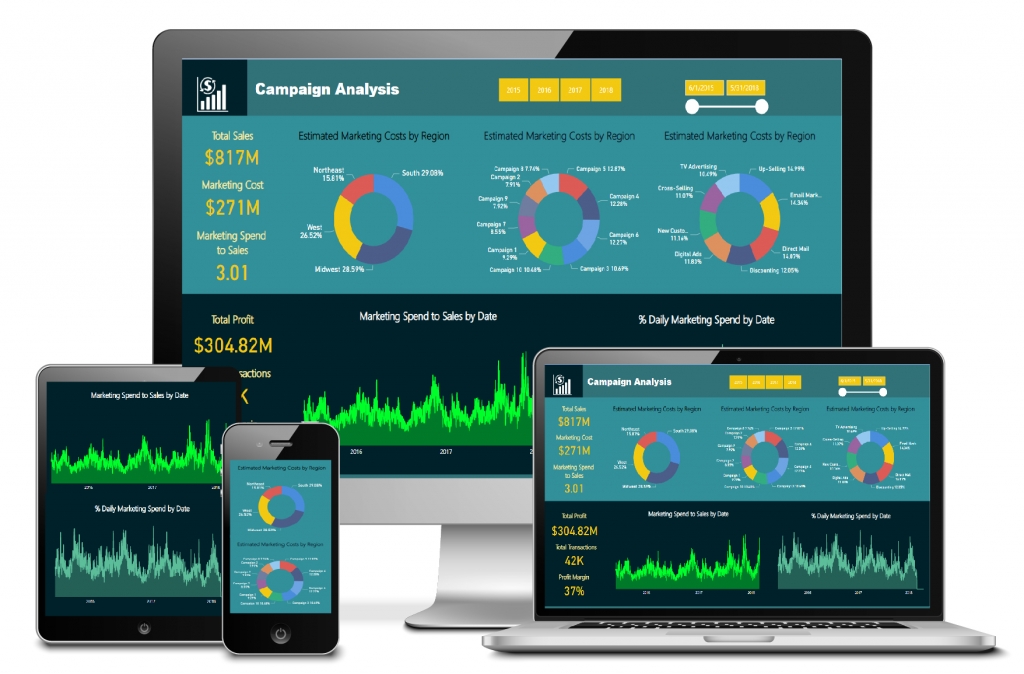
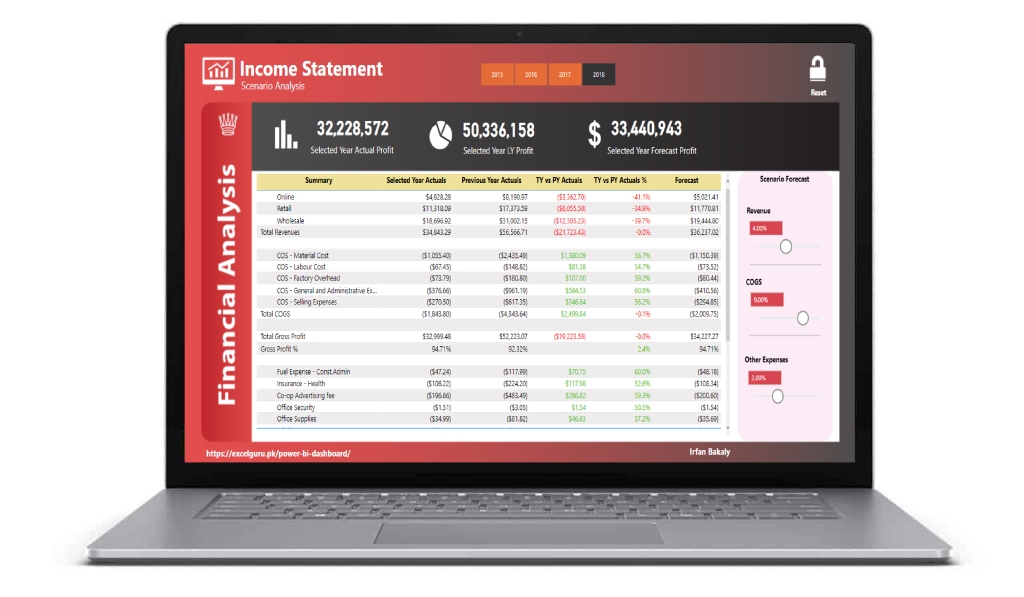
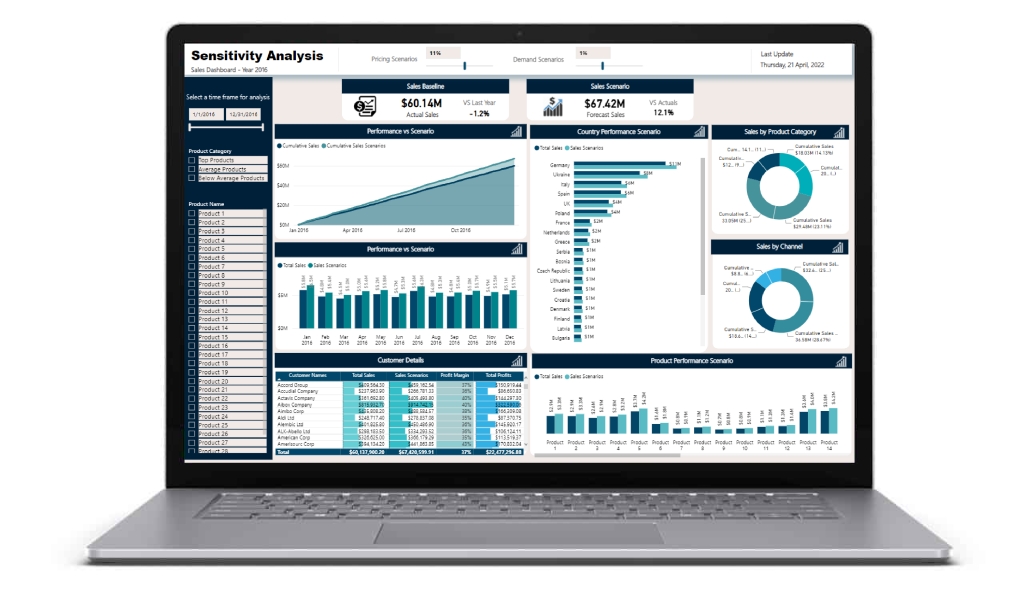
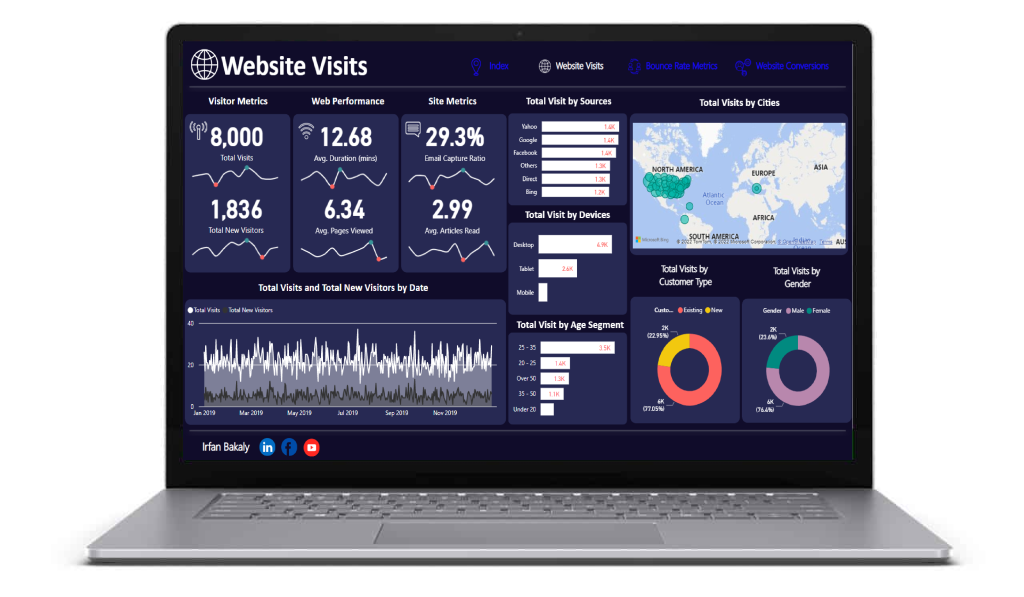
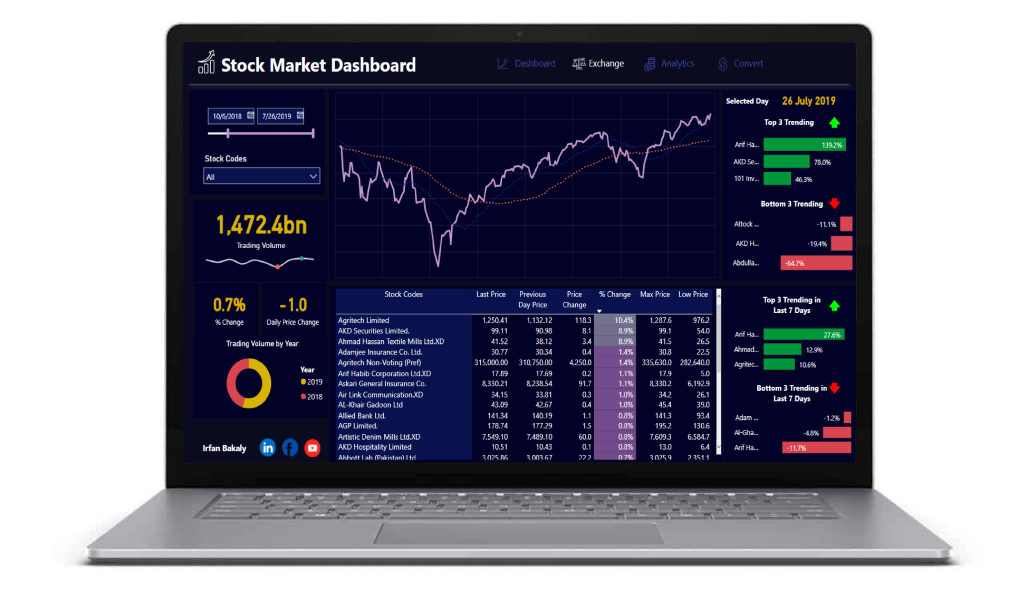
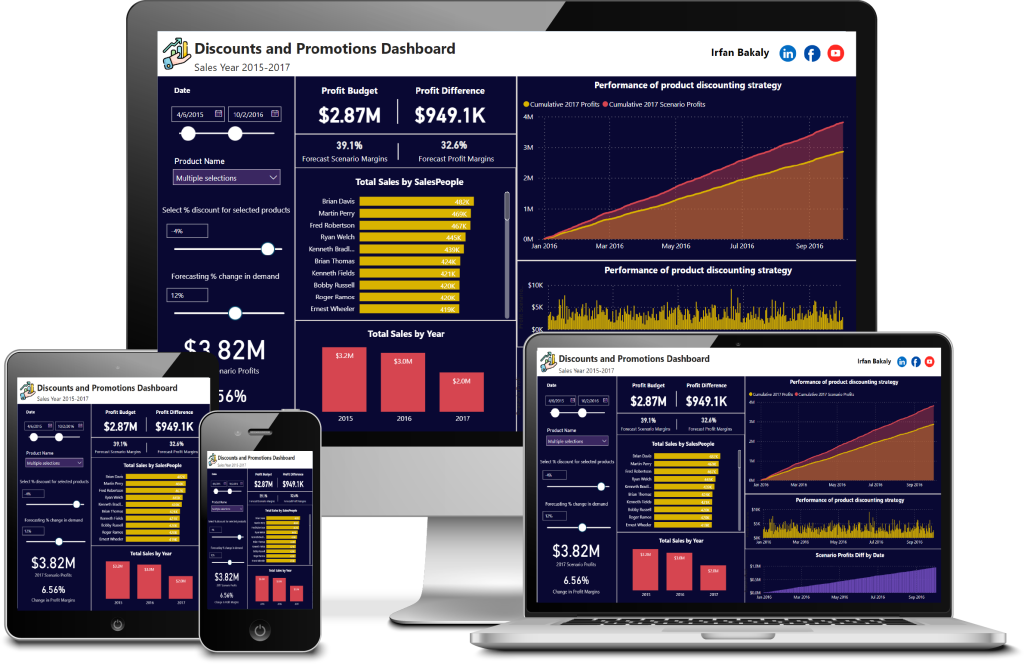
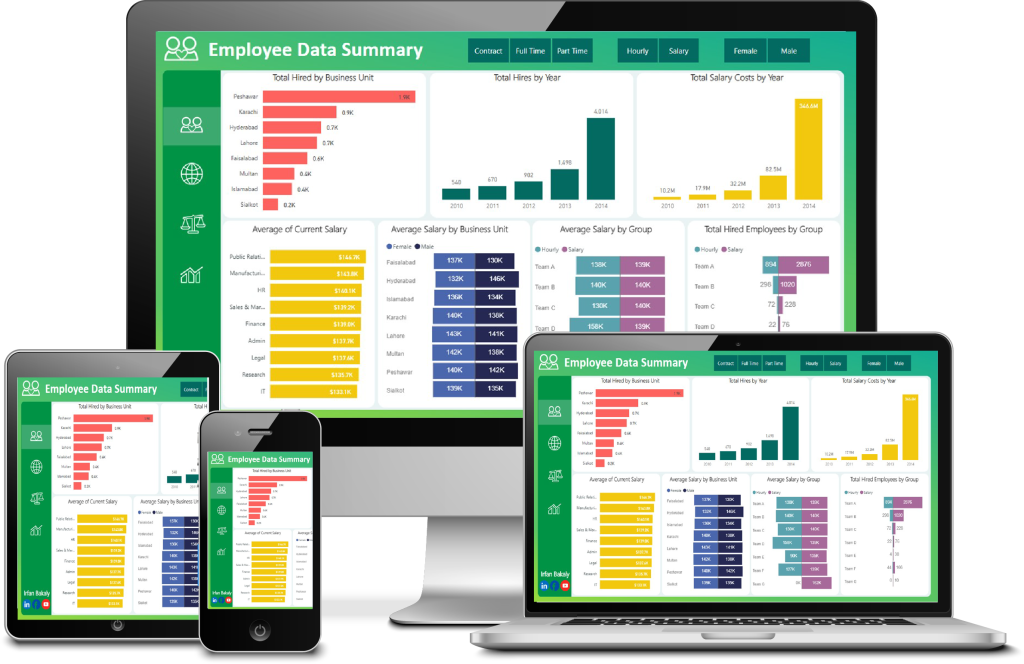
One of the key features of Power BI is its data visualization capabilities. It offers a range of charts, graphs, and other visual tools to help businesses visualize and interpret data in a meaningful way. For example, businesses can use Power BI to create dashboards that display key performance indicators (KPIs) and other important metrics in real-time, enabling them to make quick and informed decisions.

Power BI also offers a range of data integration and analysis tools that allow businesses to connect to and analyze data from multiple sources. For example, businesses can use Power BI to pull data from Excel spreadsheets, SQL databases, and cloud-based applications like Salesforce and Google Analytics. This allows businesses to get a holistic view of their data and understand how different data sets are related to each other.

Power BI Showcase

Need to discover the right BI solution for your business data?

Live Interaction – Click on any image below to interact with the solutions

Power BI also offers a range of collaboration tools that allow businesses to share data and insights with team members and stakeholders. For example, businesses can use Power BI to create reports and dashboards that can be accessed by multiple users and shared via email or social media. This allows businesses to easily share data insights with team members and stakeholders, enabling them to make informed decisions together.

In addition to its powerful data visualization and analysis tools, Power BI also offers a range of security features to ensure that data is kept safe and secure. For example, businesses can use Power BI to set access controls and permissions, ensuring that only authorized users can access data and insights.

Overall, Power BI is a powerful business intelligence solution that allows businesses to connect to, analyze, and visualize data from multiple sources, enabling them to make informed decisions and drive business growth. Whether you are a small business looking to analyze data from a few sources, or a large enterprise with complex data needs, Power BI can help you make sense of your data and drive business success.

Learning & Development Dashboard

Learning & Development Dashboard

A Learning & Development Dashboard in Power BI is a powerful tool for tracking and analyzing employee learning and development activities. It allows managers to see how their employees are progressing through various training programs, how much time they are spending on learning, and what areas they are excelling in or struggling with. With this information, managers can make informed decisions about how to allocate resources and support employees in their development. The dashboard can also be customized to display data from various sources, such as HR systems and learning management systems, to provide a complete picture of employee development. Overall, the Learning & Development Dashboard in Power BI is a valuable asset for organizations looking to invest in their employees and drive business success.

Marketing Campaign Analysis

A marketing campaign analysis dashboard in Power BI allows marketers to track and analyze the effectiveness of their campaigns in real-time. It provides an overview of key metrics such as campaign reach, engagement, conversion rates, and ROI. By visualizing data from various sources, such as social media platforms, email marketing, and website analytics, marketers can gain insights into what is working and what needs improvement. The dashboard can also be customized to display specific data points or metrics that are most important to the business, making it easy to identify trends and areas for optimization. Overall, a marketing campaign analysis dashboard in Power BI helps marketers make data-driven decisions to improve the success of their campaigns.

Admission Dashboard

The Admission Dashboard in Power BI is a powerful tool for managing and tracking admissions data for schools and universities. It allows users to visualize and analyze key metrics such as acceptance rates, application volumes, and enrollment trends. The dashboard includes interactive charts and graphs that allow users to drill down into specific data points and see detailed breakdowns of admissions data. Additionally, the dashboard includes real-time updates and alerts, allowing users to stay up-to-date on changes in admissions trends. Overall, the Admission Dashboard in Power BI is a valuable resource for any institution looking to better understand and manage its admissions process.

Financial Dashboard

Financial Dashboard

A financial dashboard in Power BI is a visualization tool that allows users to track and analyze financial data in real time. It can be used to display key financial metrics, such as revenue, expenses, and profits, in an easy-to-understand format. The dashboard allows users to drill down into specific data points, view trends over time, and compare data from multiple sources. It also enables users to create custom reports and alerts to stay informed of changes in financial performance. With a financial dashboard in Power BI, businesses can make more informed financial decisions, identify areas for improvement, and optimize their operations for maximum profitability.

Customer Relationship Management

Sales Performance

A customer relationship management (CRM) dashboard in Power BI is a powerful tool that helps businesses track and analyze customer interactions and data throughout the customer lifecycle. It provides a comprehensive view of customer interactions, including sales, marketing, and customer service data. With the CRM dashboard, businesses can identify trends and patterns in customer behavior, as well as identify opportunities for improvement. The dashboard also helps businesses to track customer satisfaction, identify key customer segments, and measure the effectiveness of marketing campaigns. Overall, the CRM dashboard in Power BI is an essential tool for businesses looking to build and maintain strong customer relationships.

Call Center KPI Dashboard

Call Center

A call center KPI dashboard in Power BI is a powerful tool for tracking and analyzing the performance of a call center. The dashboard allows managers to track key metrics such as average call handle time, average speed of answer, and abandonment rate. It also allows managers to see how their team is performing against specific goals and targets. The dashboard is customizable, allowing managers to select the specific KPIs that are most important for their call center. By regularly reviewing the dashboard, managers can identify areas for improvement and take action to optimize performance. Overall, a call center KPI dashboard in Power BI is an essential tool for driving continuous improvement in call center performance.

Human Resource Analytics Dashboard

HR Analytics

A HR analytics dashboard in Power BI is a powerful tool for HR professionals to visualize and analyze data related to their employees. The dashboard allows users to track key metrics such as employee turnover rate, diversity statistics, and performance reviews. It also allows users to create custom visualizations and reports, such as charts and graphs, to better understand trends and patterns within the organization. By analyzing this data, HR professionals can identify areas for improvement and make informed decisions to drive the success of their organization. Overall, the HR analytics dashboard in Power BI is an essential tool for any HR team looking to optimize their processes and improve the overall effectiveness of their department.

Sales Analytics Dashboard

Sales Analytics

Sales analytics dashboards in Power BI provide businesses with a comprehensive overview of their sales performance. These dashboards use data visualization to display key metrics, such as revenue, number of sales, and average sales per customer. They also allow users to drill down into more specific data, such as sales by region or product line. Additionally, sales analytics dashboards can be configured to include data from multiple sources, such as CRM systems and e-commerce platforms, allowing for a more complete picture of sales performance. By using a sales analytics dashboard, businesses can quickly identify trends and opportunities for growth, as well as areas for improvement.

Banking Clients Dashboard

Banking Clients

A banking clients analytics dashboard in Power BI is a powerful tool that allows banks to analyze and visualize their client data in real-time. It provides an overview of key metrics such as customer acquisition, retention, and satisfaction, as well as detailed insights into customer behavior and demographics. The dashboard can also be customized to focus on specific segments, such as high-value clients or those with high risk profiles. By leveraging this dashboard, banks can better understand their clients’ needs and preferences, and make informed decisions about marketing campaigns, product development, and customer service strategies. Additionally, the dashboard can help banks identify trends and patterns in customer behavior, enabling them to better anticipate and respond to changing market conditions.

Advertising & Marketing Campaigns Dashboard

Advertsing and Marketing

The Advertising & Marketing Campaigns dashboard in Power BI is a powerful tool that allows businesses to analyze and visualize the performance of their marketing efforts. The dashboard provides insights into key metrics such as reach, engagement, and conversion rates, allowing businesses to track the effectiveness of their campaigns and make data-driven decisions about their marketing strategy. The dashboard also allows businesses to compare the performance of different campaigns and identify areas for improvement, as well as monitor the performance of their competitors. Overall, the Advertising & Marketing Campaigns dashboard in Power BI is a valuable resource for businesses looking to optimize their marketing efforts and drive business growth.

Car Loan Calculator

The Car Loan Calculator dashboard in Power BI allows users to input various loan parameters, such as the loan amount, interest rate, and loan term, to calculate the monthly payment and total cost of the loan.

Car Insurance Calculator

The Car Insurance Calculator dashboard in Power BI provides a comprehensive overview of car insurance rates and coverage options. With this dashboard, users can easily calculate their estimated car insurance costs and make informed decisions about their coverage.

What-If-Analysis

What-If-Analysis in Power BI allows users to analyze the potential impact of changing specific variables on their data. This feature allows users to enter different values for a selected variable and observe how it affects the overall data visualization. This feature is useful for analyzing the impact of different scenarios on business decisions, such as analyzing the impact of changes in sales or pricing on profitability. By using What-If-Analysis, users can better understand the potential outcomes of different decisions and make more informed decisions.

Sensitivity Analysis

Sensitivity analysis in Power BI is a tool that allows users to explore the potential impact of different variables on a specific metric or calculation. By altering the values of key variables, users can quickly see how changes in those variables affect the overall output of the data model. Sensitivity analysis is a useful tool for identifying potential risks and opportunities within a business, and can help decision-makers make informed choices based on the data.

Website Analytics Dashboard

A Website Analytics Dashboard in Power BI is a powerful tool for businesses and organizations to analyze and understand the performance of their website. It provides real-time data on key metrics such as traffic, conversion rates, and customer behavior. This information can be used to optimize website design, content, and marketing campaigns to drive business growth. The dashboard is user-friendly and customizable, allowing users to easily track and compare data over time. By leveraging the power of Power BI, businesses can gain valuable insights and make informed decisions to improve their online presence and reach.

Stock Market Dashboard

A Stock Market Dashboard in Power BI allows users to track the performance of various stocks and market indices in real-time. The dashboard provides an overview of key metrics such as stock price, volume, and market cap, as well as market trends and news updates. Users can customize the dashboard to track specific stocks and set alerts for changes in price or other metrics. The dashboard can be accessed from any device and is a valuable tool for investors and financial professionals looking to make informed decisions about the stock market.

Discounts and Promotions Dashboard

The Discounts and Promotions Dashboard in Power BI allows businesses to track and analyze their discounts and promotions in real-time. With this dashboard, businesses can easily view data on the performance of their promotions, compare different promotions, and identify areas for improvement. The dashboard also provides insights into customer behavior and helps businesses make informed decisions about their marketing strategy. Overall, the Discounts and Promotions Dashboard is a valuable tool for businesses looking to optimize their marketing efforts and drive sales.

Discounts and Promotions Dashboard

Employee Data

The employee data summary dashboard in Power BI allows users to quickly and easily view key metrics and trends related to their employee data. It features interactive charts and graphs that provide insight into things like employee turnover, productivity, and performance. The dashboard also allows users to drill down into specific data sets and filter by various criteria, making it a powerful tool for analyzing and understanding employee data. Overall, the employee data summary dashboard in Power BI is a valuable resource for HR professionals and managers looking to gain a deeper understanding of their workforce.

Employee Data