logo-mini

Excel Dashboard Showcase

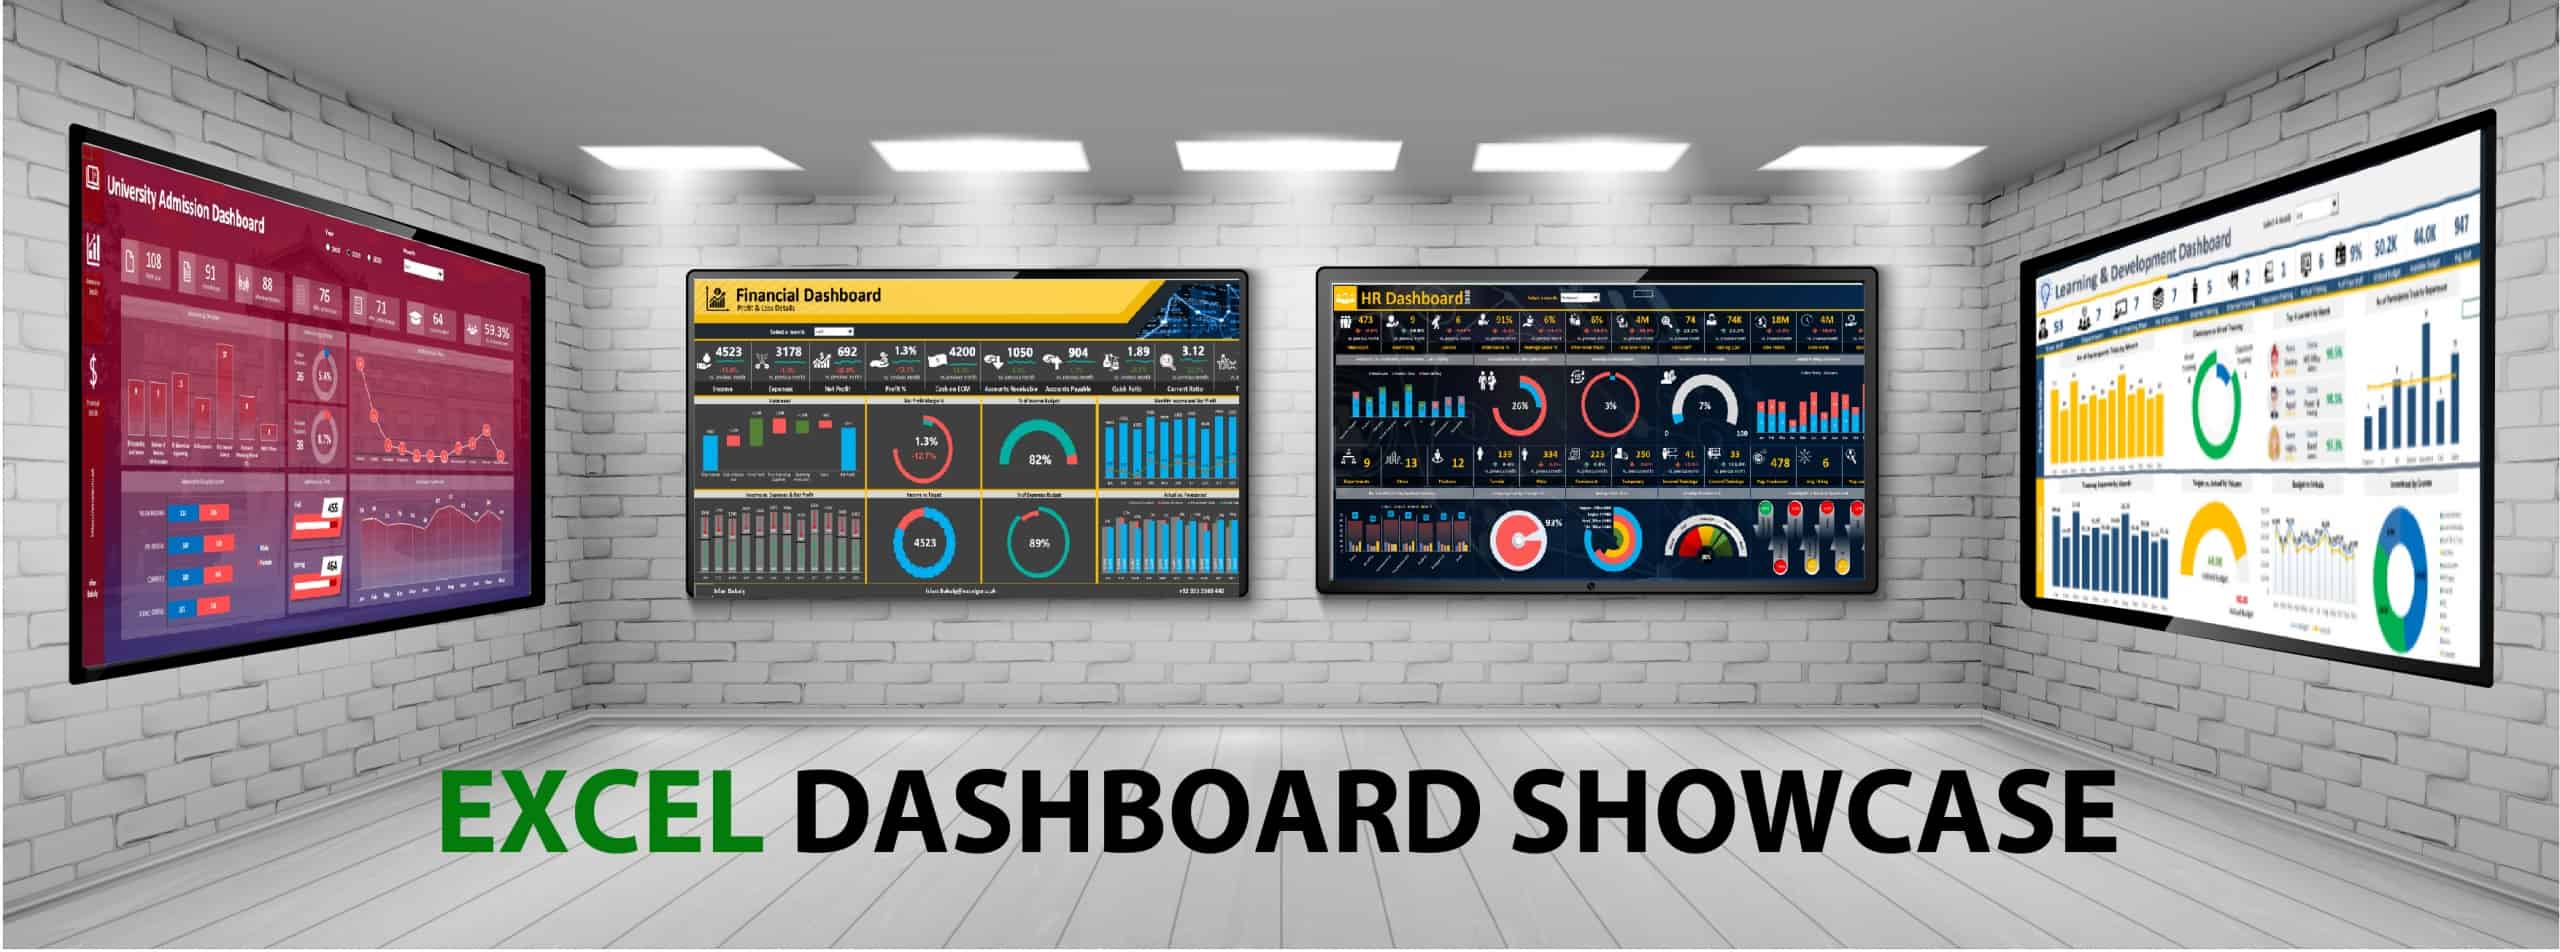
Microsoft Excel is a powerful tool for organizing, analyzing, and presenting data. One of its most useful features is the Excel dashboard, which allows users to quickly and easily visualize and understand large amounts of data.

One of the main advantages of using an Excel dashboard is the ability to customize and tailor the display to specific needs and goals. With a wide range of chart types and formatting options, users can create a dashboard that clearly communicates their data in a way that is meaningful and easily understood.

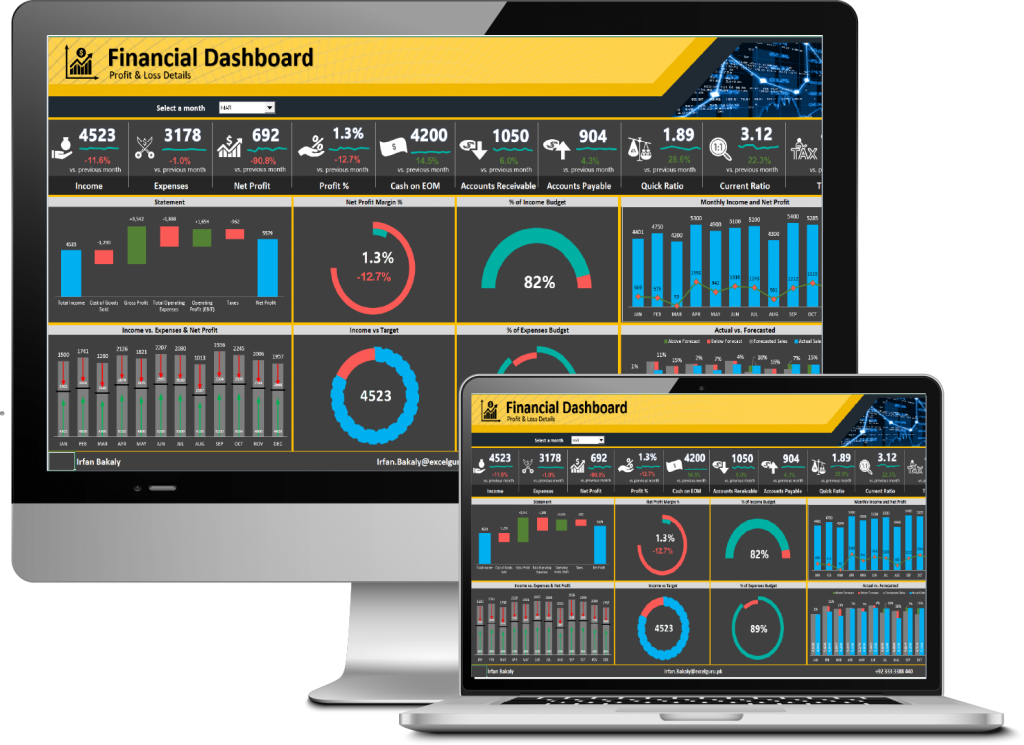
Another advantage of Excel dashboards is their ability to save time and improve efficiency. Rather than manually analyzing and interpreting data, users can quickly and easily see trends and patterns by looking at the dashboard. This can help users make informed decisions faster and with more confidence.

Excel Dashboard Showcase

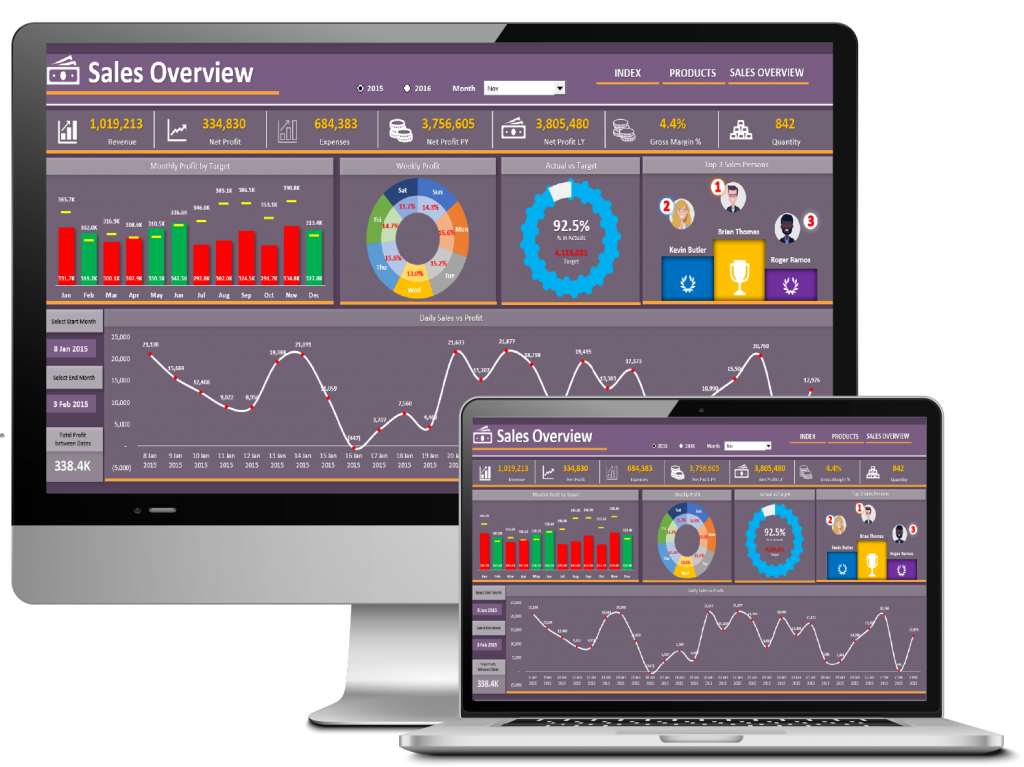
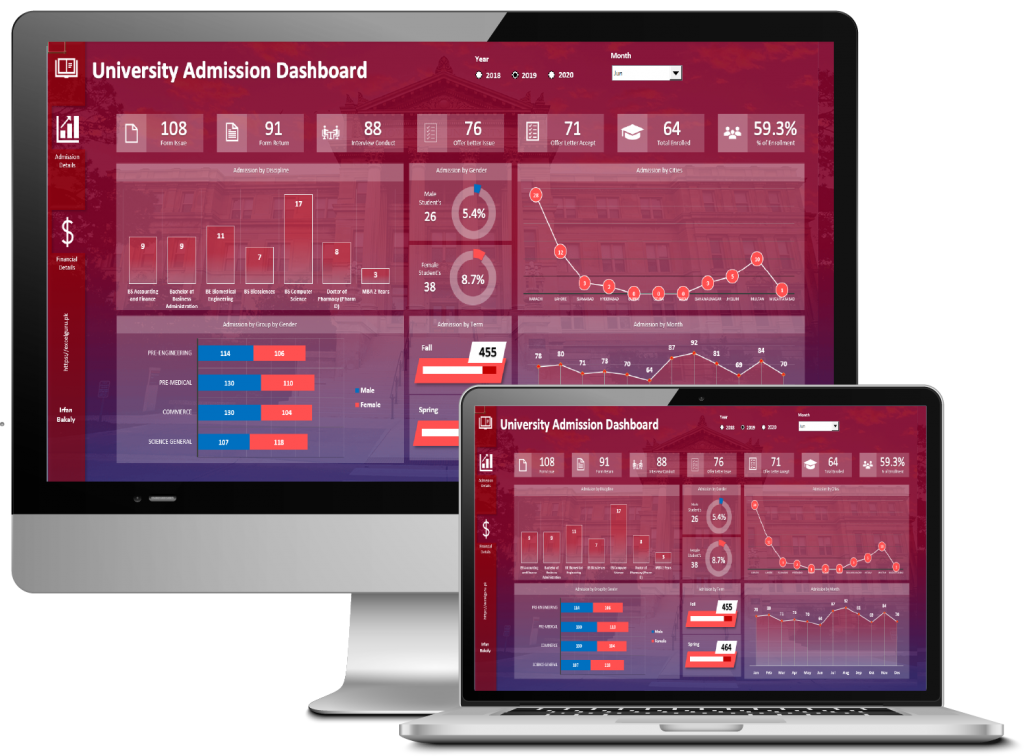
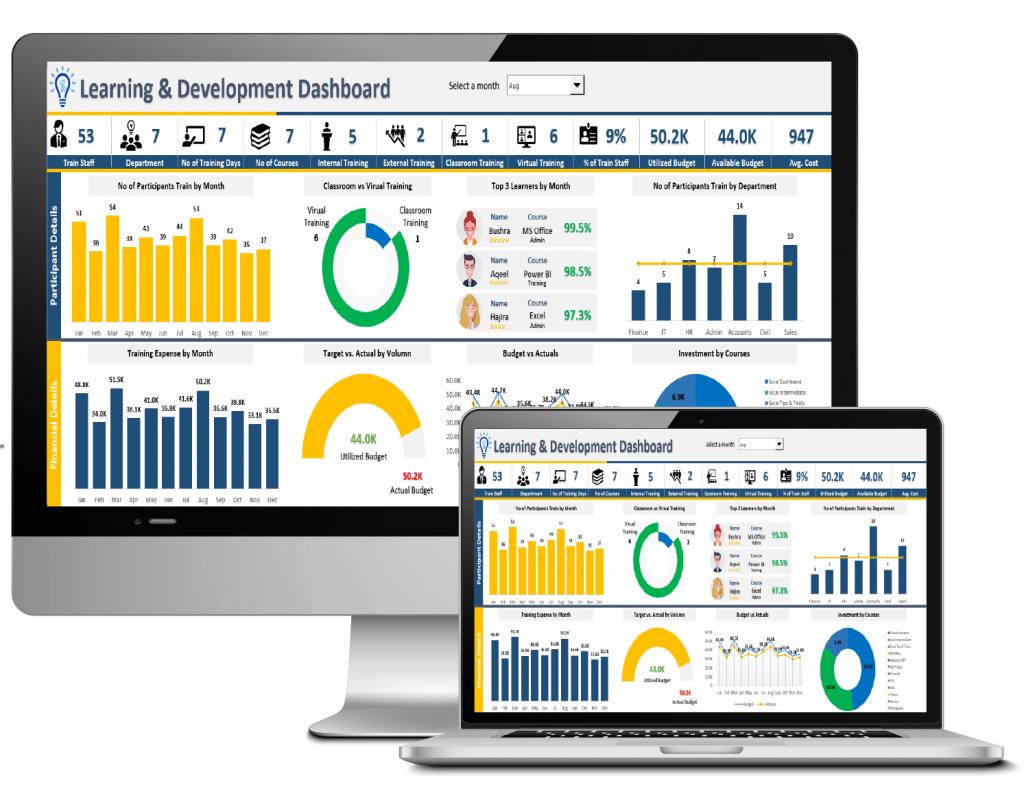
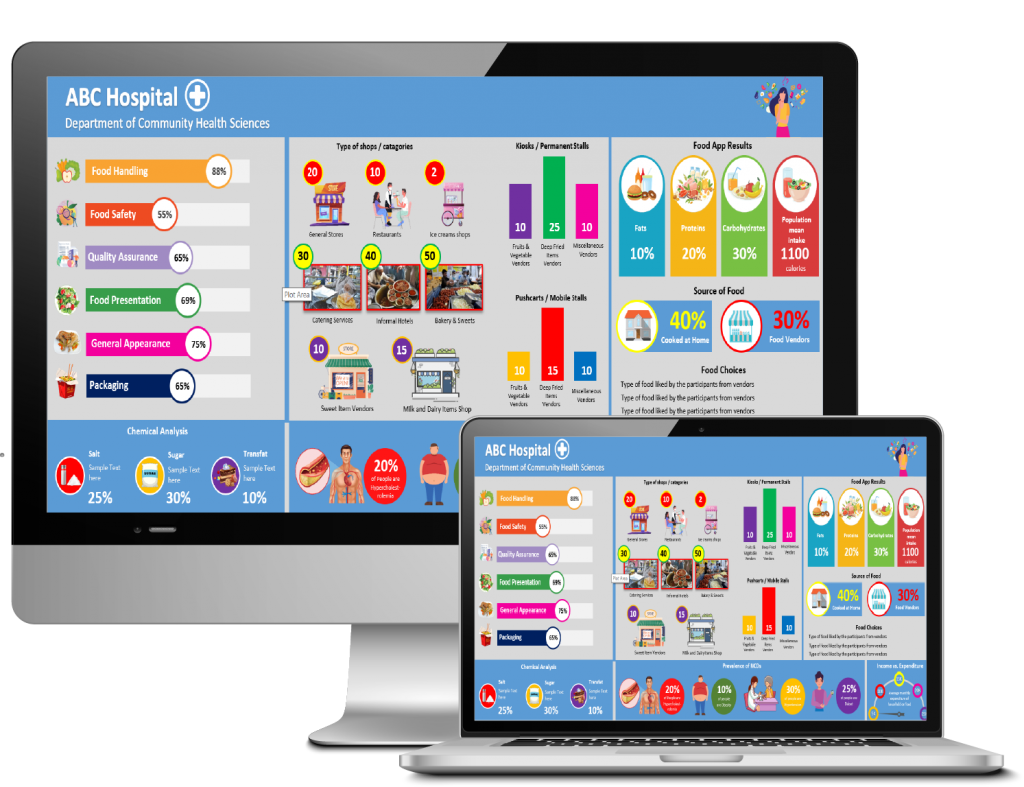
Need to discover the right Excel Dashboard solution for your business data?

Click to download the sample interactive dashboard

Excel dashboards are also highly interactive, allowing users to drill down into the data and explore specific areas of interest. For example, users can click on a specific data point to see more detailed information, or filter the data to focus on specific categories. This makes it easier to gain insights and understand the data in more depth.

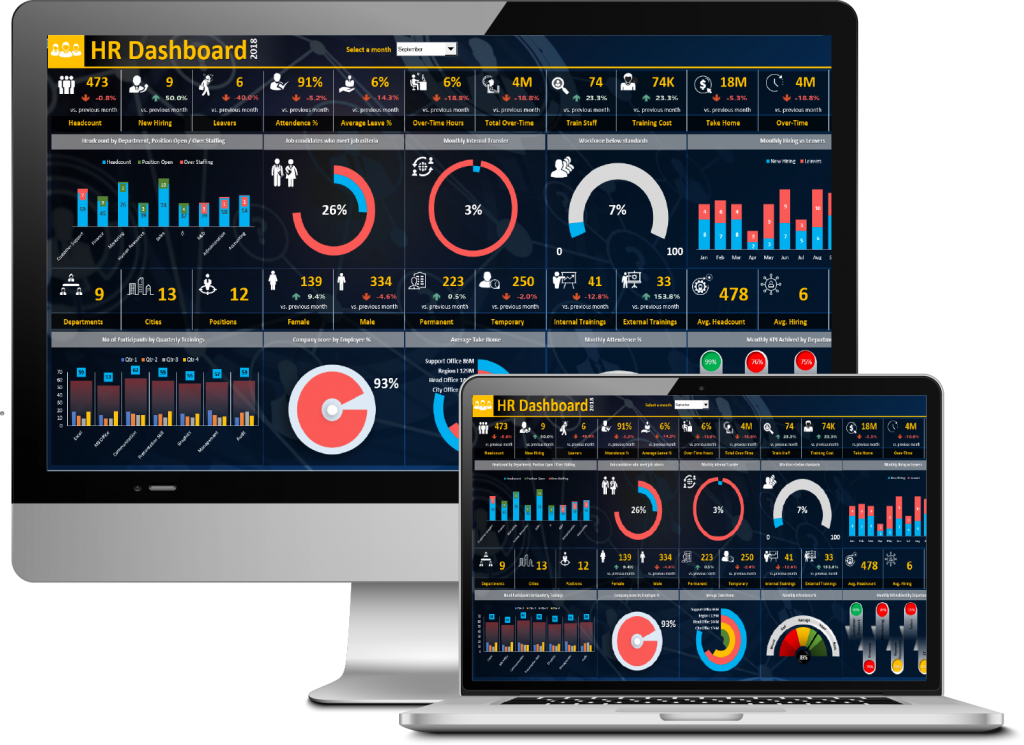
In addition, Excel dashboards are easy to share and collaborate on. Users can save their dashboard as a file or share it through Excel’s online collaboration tools, allowing multiple people to view and interact with the data in real-time.

Overall, the Excel dashboard is a valuable tool for anyone looking to analyze and understand data in a more efficient and effective way. Its customization, interactivity, and collaboration capabilities make it a powerful tool for any business or organization.

Sales Dashboard

Sales Dashboard

A sales dashboard on Microsoft Excel is a powerful tool that helps businesses track and analyze their sales data. It provides an overview of key performance indicators such as sales volume, revenue, and customer acquisition. The dashboard includes interactive charts and graphs that allow users to easily visualize and compare data across different time periods. It also allows users to drill down into specific data points for more detailed analysis. Overall, a sales dashboard on Excel can help businesses make informed decisions about their sales strategy and improve their overall sales performance.

Orange Download

Financial Dashboard

Financial Dashboard - Excel

A financial dashboard on Microsoft Excel is a powerful tool for tracking and analyzing financial data. It allows you to visualize key metrics and trends in real-time, so you can make informed decisions about your financial performance. With a financial dashboard, you can easily track your income and expenses, monitor your budget, and analyze your financial statements. You can also customize the dashboard to show the data that is most important to you, so you can get a clear picture of your financial health at a glance. Overall, a financial dashboard on Microsoft Excel is an essential tool for anyone looking to stay on top of their finances.

Orange Download

HR Analytics Dashboard

HR Analytics Dashboard - Excel

A HR dashboard on Microsoft Excel is a powerful tool that allows HR professionals to easily track and analyze key HR metrics and data. It provides a clear, visual representation of key HR metrics such as employee turnover rate, employee satisfaction, and employee retention, making it easy to identify trends and take action to improve HR performance. The dashboard can be customized to fit the needs of the HR team and can be accessed and updated in real-time, making it an essential tool for managing HR performance and driving business success.

Orange Download

University Admission Dashboard

University Admission Dashboard - Excel

The university admission dashboard on Microsoft Excel allows students to track their application status, review their transcripts and test scores, and view their acceptance or rejection letters. It also displays key admissions data such as acceptance rates and average GPA for each program. The dashboard provides a convenient and organized way for students to stay up-to-date on the progress of their application and make informed decisions about their academic future.

Orange Download

Learning & Development Dashboard

L&D Dashboard - Excel

The Microsoft Excel Dashboard is an excellent tool for learning and development. It allows users to quickly and easily create and customize dashboards to track progress and measure success. With a wide range of features and functions, the Excel Dashboard provides a powerful platform for managing and analyzing data. Whether you are a beginner or an advanced user, the Excel Dashboard can help you learn and develop your skills in data analysis and visualization. So if you want to improve your knowledge and skills in data analysis, the Excel Dashboard is a great place to start.

Orange Download

Dynamic Infographics Dashboard

Inforgraphics Dashboard - Excel

An infographic dashboard on Microsoft Excel is a visual representation of data and information that allows for easy interpretation and understanding. It can be created using various charts and graphs, and can be customized to fit the specific needs of the user. The dashboard can be used to track and analyze data, identify trends and patterns, and make informed decisions. It is a powerful tool for businesses and organizations looking to streamline their data analysis process and make data-driven decisions.

Orange Download