
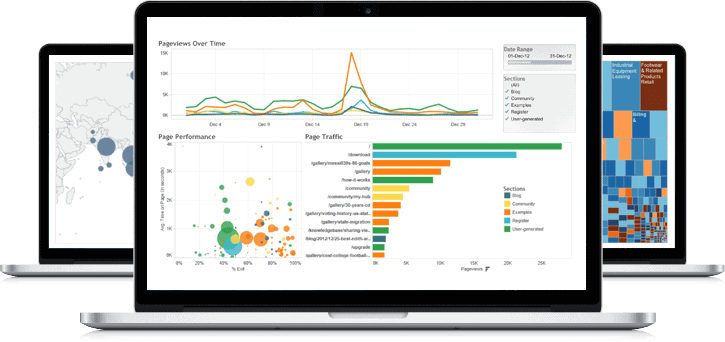
Tableau is a data visualization tool that helps businesses and organizations see and understand their data in new ways. With its interactive dashboards and charts, Tableau allows users to quickly and easily explore their data and find insights that would be hidden in traditional reports or spreadsheets. It is used across a variety of industries, including finance, healthcare, education, and retail. Tableau’s software is available in both desktop and online versions, making it accessible to teams of all sizes and locations. The tool also has a strong community of users and developers, who share tips, tricks, and insights on how to get the most out of the software. Overall, Tableau is a powerful and user-friendly tool that helps organizations make sense of their data and make informed decisions.
Tableau
Learn Tableau 2020 for data science step by step. Real-life data analytics exercises & quizzes included.
Course Duration & Payment Details
Days: Monday & Wednesday
Timing: 07:00 to 09:30pm
Duration: 20 hours
Starting from: Monday, 08 February 2021
Last date of registration: Monday, 01 February 2021
Actual Fee: 18000/- | Early bird discount: 9000/-
How to Pay: Online Payment
Bank: Habib Bank Limited
Title: Irfan
Account No: 0011557900292501 | PK02HABB0011557900292501
What you will learn
- Install Tableau Desktop 2020
- Connect Tableau to various Datasets: Excel and CSV files
- Create Barcharts
- Create Area Charts
- Create Maps
- Create Scatterplots
- Create Piecharts
- Create Treemaps
- Create Interactive Dashboards
- Create Storylines
- Understand Types of Joins and how they work
- Work with Data Blending in Tableau
- Create Table Calculations
- Work with Parameters
- Create Dual Axis Charts
- Create Calculated Fields
- Create Calculated Fields in a Blend
- Export Results from Tableau into Powerpoint, Word, and other software
- Work with Timeseries Data (two methods)
- Creating Data Extracts in Tableau
- Understand Aggregation, Granularity, and Level of Detail
- Adding Filters and Quick Filters
- Create Data Hierarchies
- Adding Actions to Dashboards (filters & highlighting)
- Assigning Geographical Roles to Data Elements
- Advanced-Data Preparation (including latest updates in Tableau)
Description
Learn data visualization through Tableau 2020 and create opportunities for you or key decision-makers to discover data patterns such as customer purchase behavior, sales trends, or production bottlenecks.
You’ll learn all of the features in Tableau that allow you to explore, experiment with, fix, prepare, and present data easily, quickly, and beautifully.
Use Tableau to Analyze and Visualize Data So You Can Respond Accordingly
- Connect Tableau to a Variety of Datasets
- Analyze, Blend, Join, and Calculate Data
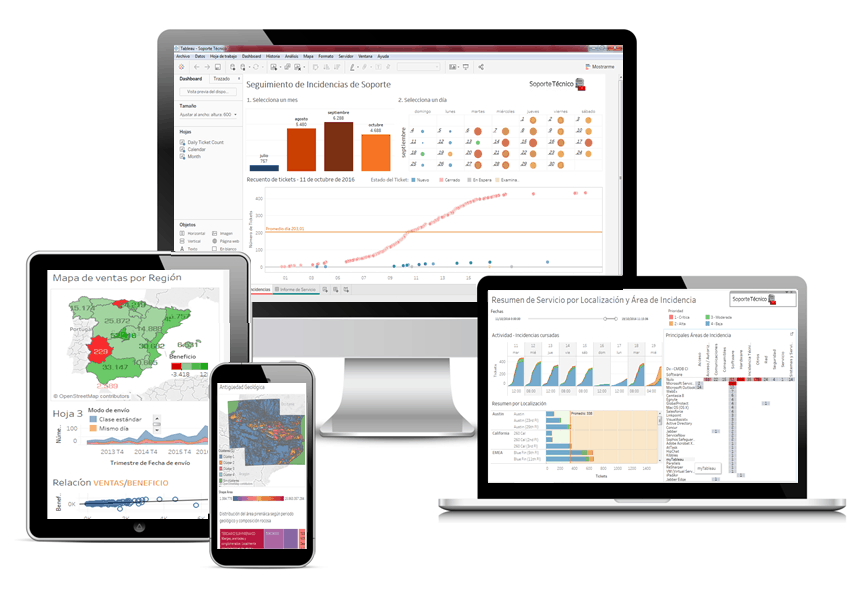
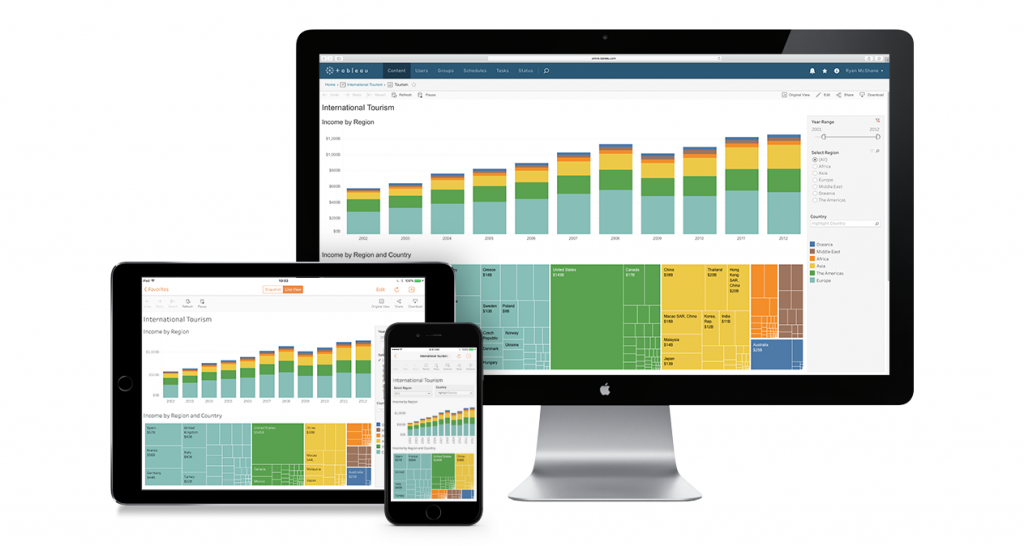
- Visualize Data in the Form of Various Charts, Plots, and Maps
Convert Raw Data Into Compelling Data Visualizations Using Tableau 2020
Because every module of this course is independent, you can start in whatever section you wish, and you can do as much or as little as you like.
Each section provides a new data set and exercises that will challenge you so you can learn by immediately applying what you’re learning.
Content is updated as new versions of Tableau are released. You can always return to the course to further hone your skills, while you stay ahead of the competition.
Contents and Overview
This course begins with Tableau basics. You will navigate the software, connect it to a data file, and export a worksheet, so even beginners will feel completely at ease.
To be able to find trends in your data and make accurate forecasts, you’ll learn how to work with data extracts and time series.
Also, to make data easier to digest, you’ll tackle how to use aggregations to summarize information. You will also use granularity to ensure accurate calculations.
In order to begin visualizing data, you’ll cover how to create various charts, maps, scatterplots, and interactive dashboards for each of your projects.
You’ll even learn when it’s best to join or blend data in order to work with and present information from multiple sources.
Finally, you’ll cover the latest and most advanced features of data preparation in Tableau 10, where you will create table calculations, treemap charts, and storylines.
By the time you complete this course, you’ll be a highly proficient Tableau user. You will be using your skills as a data scientist to extract knowledge from data so you can analyze and visualize complex questions with ease.
You’ll be fully prepared to collect, examine, and present data for any purpose, whether you’re working with scientific data or you want to make forecasts about buying trends to increase profits.
Who this course is for:
- You should take this course if want to learn Tableau completely from scratch
- You should take this course if you know some Tableau skills but want to get better
- You should take this course if you are good with Tableau and want to take your skills to the next level and truly leverage the full potential of Tableau
Tableau (Basic to Advanced)
- Introduction of Tableau
- Tableau – Download & Installation requirement
- Tableau Interface
- Tableau vs Excel
- Tableau vs other BI Tools
- Connecting with Different Database
- Import Data from Excel
- Basic Formatting
- Refreshing Data
- Understand Tableau Data types
- View Data
- Hide & Un-Hind Column
- Add some filter in the Data view
- Rename column in Tableau
- Copy the data
- Split / Custom Split
- Sorting Columns, Data & Visuals
- Drill Down and Hierarchies
- Grouping
- Measure Name And Values
- Measure Names Usage
- Discrete Vs Continuous
- Parameters and Sets
- Working with Filter in Graph
- Date Filter
- Advance Interactive Filters
- Data Source Filters
- Combine
- Title And Caption
- Save & Exporting
- Granularity
- Managing Metadata
- Hide / Un-Hide fields
- Rename fields
- Group by folder
- Search a fields
- Create Calculate fields
- Cross-Database Joins
- Data Blending
- Data Blending Calculations
- Working with Size, Color, Label, Tooltip, Detail, Shapes, Font, Alignment, Shading & Borders
- Basic Calculations
- (Sum, Multiplication, Division, Subtract, Percentage, Min, Max, Count, Average, Ceiling, Floor, etc.)
- Working with Text Function
- Upper, Lower, Proper, Left, Right
- Transform Data
- Quick Table Calculation
- Compute Using
- Conditional Formatting
- Index, Last, Top N, Bottom N
- RANK, RANK_DENSE, RANK_MODIFIED
- Logical Statement – IF
- Understanding of Charts
- Word Map
- Reference Line
- Understanding of Chart
- Which chart required for which data?
- Data visualization in Map
- Worksheet Options
- Duplicate, Copy, Paste, Hide, Un-Hide, Rename, Color, Delete
- Highlighting
- Actions Filter
- Creating Dashboard
- Story Point
- Device Designer
- Online Introduction
- Publishing Reports
- Interacting with Tableau online
- Trend lines
- Analytics
- Distributing and Publishing
- Tableau Server
- Tableau Online
- Pivot in Tableau
- Join Types with Union
- Union Data
- Cross-database Joins (important)
- Data Blending (important)
- Connecting to PDFs (important)
- Connecting to Cubes
- Parameters (important)
- Bins (5. Additional Ways to Group)
- Add Target line / Reference Line
- Forecasting
- Clustering
- Dynamic Dashboard Caption
- Spatial Files (map)
- Density (Heat Map)
- Calculated formulas and functions
- Field Set
- Table Calculations
- Multiple Measures
- New Mobile Feature