Power BI is a data visualization and business intelligence tool that helps organizations transform data into interactive and visually appealing dashboards and reports. It allows users to connect to various data sources, such as Excel spreadsheets, databases, and cloud services, and create stunning data visuals with minimal effort. With Power BI, users can easily analyze and explore data, identify trends and patterns, and share insights with their team or customers. Additionally, Power BI offers various features such as data modeling, data exploration, and real-time data streaming, which enable users to gain a deeper understanding of their data and make informed decisions. Overall, Power BI is an essential tool for businesses looking to improve their data analysis and reporting capabilities.
Power BI Training
Course Duration & Payment Details
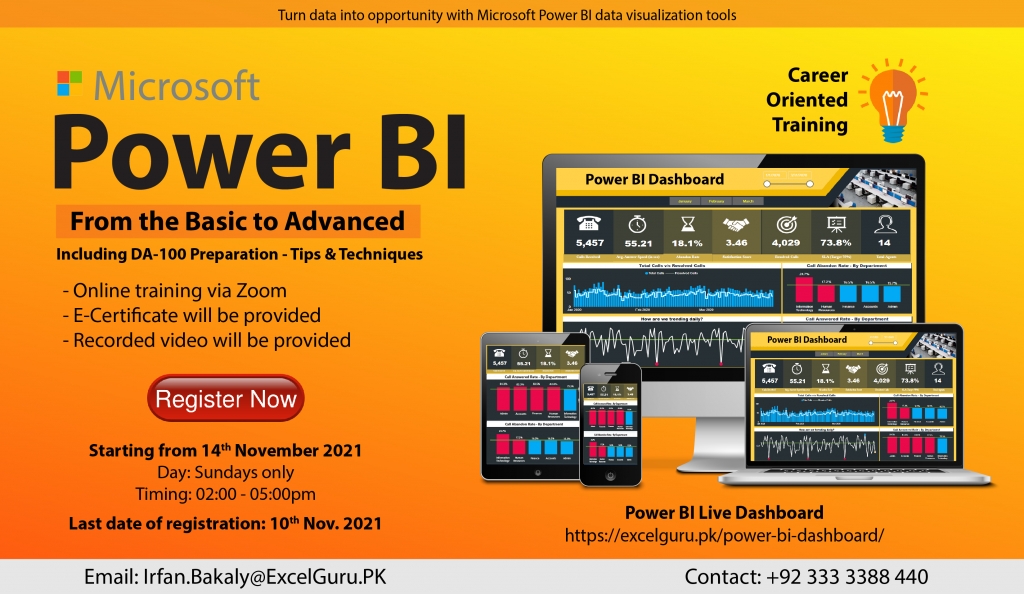
Day: Sundays only
Timing: 02:00 to 05:00pm
Duration: 18 hours
Starting from: Sunday, 14 November 2021
Last date of registration: Wednesday, 10 November 2021
Actual Fee: 18,000/- | Early bird discount: 9,000/-
How to Pay: Online Payment
Bank: Habib Bank Limited
Title: Irfan
Account No: 0011557900292501 | PK02HABB0011557900292501
Training Highlights
Theory Time:
- What is a data warehouse
- Concept of ETL
- Data warehouse Characteristics
- Data warehouse Schema
- The Star Schema
Getting started
- What is BI?
- What are Self Service BI and the steps involved?
- Overview of Power BI
- Different products of Power BI
- Power BI licensing and features
- Power BI pros and cons
- Other self-service BI tools and comparison
Power BI desktop – data extraction
- Exploring different data sources and connectors
- Data extraction from the Web
- Data extraction from Access Database
- Data extraction from Online Services
- Data extraction from Excel Workbook
Data Visualization in Power BI Desktop
- Visualization Best Practices
- Which Chart is the Best?
- Basic Charts
- Interaction of Visuals
- Color Formatting
- Setting Sort Order
- Tooltips
- Slicers & Timeline Slicers
- Cross Filtering and Highlighting
- Visual, Page, and Report Level Filters
- Drill Down/Up
- Hierarchies
- Map Visuals
- Scatter Chart
- Line Chart
- Table and Matrix with Conditional Formatting
- Multiple levels of filters
- Using custom slicers
- Switch between web/phone layout
- Inserting shapes, images, and text boxes
- Drill Down
- Tooltip
- Hyperlink & Bookmark
Working with Custom Visuals
Power BI desktop – data transformation / Edit Queries
- What is Power Query?
- Power Query in Excel and Power BI
- Basic Transformations
- Get Data
- Different Data Sources
- Get Data from Web
Query Editor
- Base structures in Power Query
- Query Editor in Details
- Get Data from CSV Files
- Get Data from Excel
- Transformation Pane
Power Query Syntax
- Data Types in Power Query
- Transformation Steps
- Query Operations; Duplicate, and Reference
- Managing Queries in Groups
Combine Queries
- Merge, Joining queries
- Append, creating a big list
- Combine Binaries; Looping through files in a folder
Transformations
- Column Operations
- Row Operations
- Filtering
- Sorting
Table Transformations
- Group By
- Transpose
- Pivot, Unpivot
Text Transformations
- Split
- Merge (Concatenate)
More Transformations
- Date Transformations (Year, Month, Quarter)
- Extending Fiscal Date Column
- Aggregate
- Add Custom Column
Power Query Formula Language: M
- What is M? and the importance of learning M
- M Syntax
- Basic examples of M
Power BI desktop – data modeling
- Introduction to relationship view navigation
- Understanding data modeling concepts
- Creating and editing relationships
- Why is a data model more efficient?
- Relationship-based on multiple Columns
- Principles of Database Normalization
- Cardinality: Many-to-One & One-to-One
- Understanding how LEFT, RIGHT, INNER, and OUTER joins work
- Cross Filter Direction & Many-to-Many
- Understanding Active Properties
- M-Language vs DAX (Data Analysis Expressions)
- Understanding the CALENDAR Function
- Managing Active vs. Inactive Relationships
Introduction to DAX
- Introduction to DAX
- Syntax of DAX
- Understanding calculated columns and measures
- Why is a measure more efficient than a column?
- Creating calculated columns
- Measures in PowerPivot
- Implicit and explicit measures
- Understanding filter context
- Measure referencing
- Editing / Deleting measures
- Logical Operations
Artificial Intelligence (AI) Visuals
Most common and demanding DAX functions / Learning Data Analysis Expression (DAX) Functional language
Date & Time Functions – Calendar, CalendarAuto, Date, Day, Month, Year, Format, Datediff, Now, Today, Weekday, Weeknum
Filter Functions – All, AllExcept, AllSelected, Calculate, Earlier, Filter, HasOneValue, IsFiltered, Related
Math & Trig Functions – Ceiling, Divide, Round, Roundup, Sum, Sumx
Logical Functions – IF, AND, OR, Switch
Time Intelligence Expressions – MTD, QTD, YTD, SamePeriodLastYear, DateAdd, DatesBetween, Running Total
Statistical Function – Average, AverageX, Count, CountA, CountBlank, CountRows, CountX, Max, MaxX, Min, MinX, MedianX, RankX, Sumarize
Text Functions – Concatenate, Format, Left, Len, Lower, Rept, Right, Trim, Unichar, Upper, Value
- Top N Values, Top N Filter, Top Order calculations, Top 10 Customers, Dynamic
Power BI service
- Logging in and understanding navigation
- What are workspaces?
- Difference between datasets, workbooks, reports, and dashboards
- Publishing data to web
Power BI Service – Dashboards
- Pinning visuals and creating dashboards
- Alignment and configuration of visuals
- Viewing reports & dashboards
- Sharing reports & dashboards
- Row-level security
Gateways
- What is Gateway?
- Types of Gateway
- On-premises Gateway in Details
- Installation, Configuration, and considerations
- Schedule Refresh
Integration
Power BI and PowerPoint