
Power BI
Power BI is a powerful business analytics tool that allows users to analyze, visualize, and share data from various sources. To learn Power BI, you will need to start by installing the software and familiarizing yourself with its interface. You can then connect to data sources and import data into your Power BI project. Once your data is imported, you can use the various tools and features in Power BI to create interactive dashboards and reports. You can also use Power BI to create and publish data models, allowing you to share your insights with others. To learn more about Power BI, you can take online courses or attend online training sessions.
Online registration form: Please click here
Course Duration & Payment Details
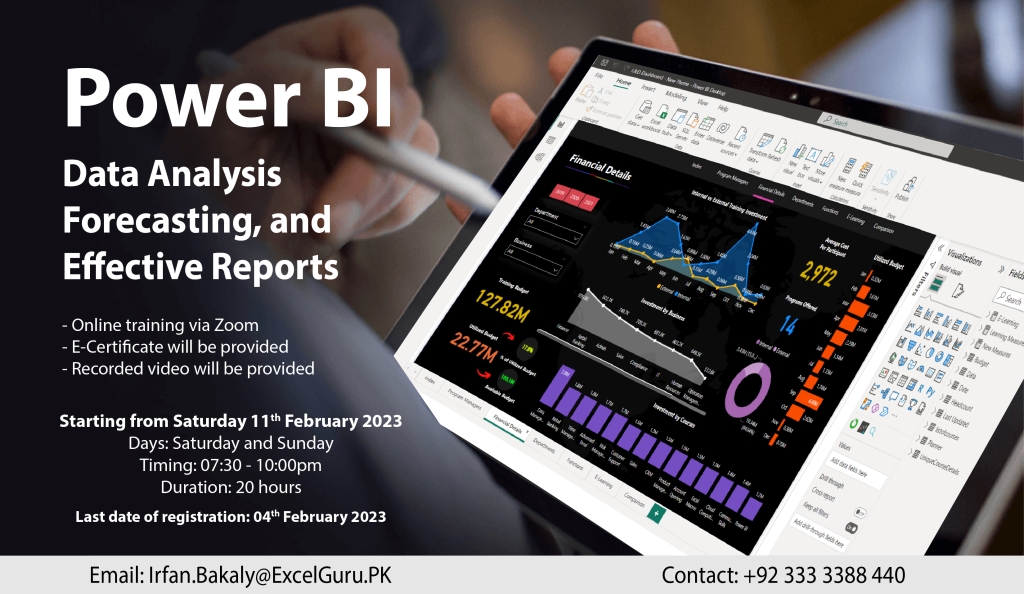
Days: Saturday and Sunday only
Timing: 07:30 to 10:00 pm
Duration: 20 hours
Starting from: Saturday, 11 February 2023
Last date of registration: Saturday, 4 February 2024
Actual Fee: 20,000/- | Early bird discount: 15,000/-
How to Pay: Online Payment
Bank: Habib Bank Limited
Title: Irfan
Account No: 11557900292501 | PK02HABB0011557900292501
Training Highlights
Getting started with Power BI
- What is BI?
- Overview of Power BI
- Different products of Power BI
- Power BI pros and cons
- Other self-service BI tools and comparison
Objective 1: Connect & Transform the Raw Data
- Prepare Data for Exploration
- Process Data from Dirty to Clean
- Analyze Data to Answer Questions
- Explanation of ETL process (Extraction – Transformation – Loading)
- Intro to the Power BI Query Editor
- Common Data Import Sources
- Working with CSV; Text; Excel Files, SQL
- Importing multiple files from multiple sources
- Importing data from Google sheets
- DirectQuery vs Import Data
- Basic Table Transformations
- Merge and Append queries
- Connecting to Folders
- Text, Number & Date Tools
- Index & Conditional Columns
- Grouping & Aggregating Data
- Pivoting & Unpivoting
- Modifying, Merging & Appending Queries
- Duplicate and Error Values
- Parameters for Loading only Required Data
- Importing Data from Meta, Google Analytics, and other social media platforms
Text Analytics for better - Query Editing & Power BI Best Practices
- Working with Date Table
Objective 2: Build a Relational Data Model
- Intro to Database Normalization
- Data (“Fact”) Tables vs. Lookup (“Dimension”) Tables
- Creating Power BI Table Relationships
- “Star” vs. “Snowflake” Schemas
- Active vs. Inactive Relationships
- Relationship Cardinality
- Connecting Multiple Data Tables
- Filtering & Cross-Filtering
- Understanding how LEFT, RIGHT, INNER, and OUTER join work
- Hiding Fields from the Power BI Report View
- Data Modeling & Power BI Best Practices
Objective 3: Add Calculated Fields with DAX
- Intro to Data Analysis Expressions (DAX)
- Calculated Columns vs. Measures
- Row Context vs. Filter Context in Power BI
- DAX Syntax & Operators
- Common Power BI Functions
- Logical & Conditional Statements
- Text, Math & Stats Functions
- Joining Data with RELATED
- CALCULATE, ALL & FILTER Functions
- Time Intelligence Formulas
- DAX & Power BI Best Practices
Objective 4: Design Interactive Power BI Reports
- Intro to the Power BI Report View
- Select the Right Visuals
- Adding Basic Charts to Power BI Reports
- Interaction of Visuals
- Inserting shapes, images, and text boxes
- Formatting & Filtering Options
- Setting Sort Order
- Table and Matrix Visuals
- Slicers & Timelines
- Cards & KPIs
- Power BI Map Visuals
- Tooltips
- Treemaps, Lines, Areas & Gauges
- Editing Report interactions
- Drill Down/Up
- Adding Drill through Filters
- Linking to Report Bookmarks and Hyperlinks
- Conditional Formatting
- Using “What-If” Parameters
- Managing & Viewing Roles
- The Key Influencers Visual
- Artificial Intelligence (AI) Visuals
- Creating an Interactive Business Intelligence Report
- Understanding aggregation and granularity
- Answer your Business Questions
- Exploring the visualization
- Incorporate Layouts, Colours, and Themes
- Data Story Telling
- Creating Bins and Distributions for Balance
- Analyzing the Customer Segmentation Dashboard
- Developing Row Level Security (RLS)
Objective 5: Power BI Service
- Power BI Cloud
- Publishing and Sharing reports/dashboards
- Implementation of RLS
- Schedule Refresh
- Natural Language Query
- Frequent Updates and Changes
BONUS:
- Budget vs Actuals Comparisons Methods
- Sales Comparisons
- Time Series Forecasting
- Forecasting Capabilities
- Evaluate the prediction quality
- Scenario Sensitivity Analysis
- HR Analytics Techniques
- Financial Dashboard Automation (Income Statement)