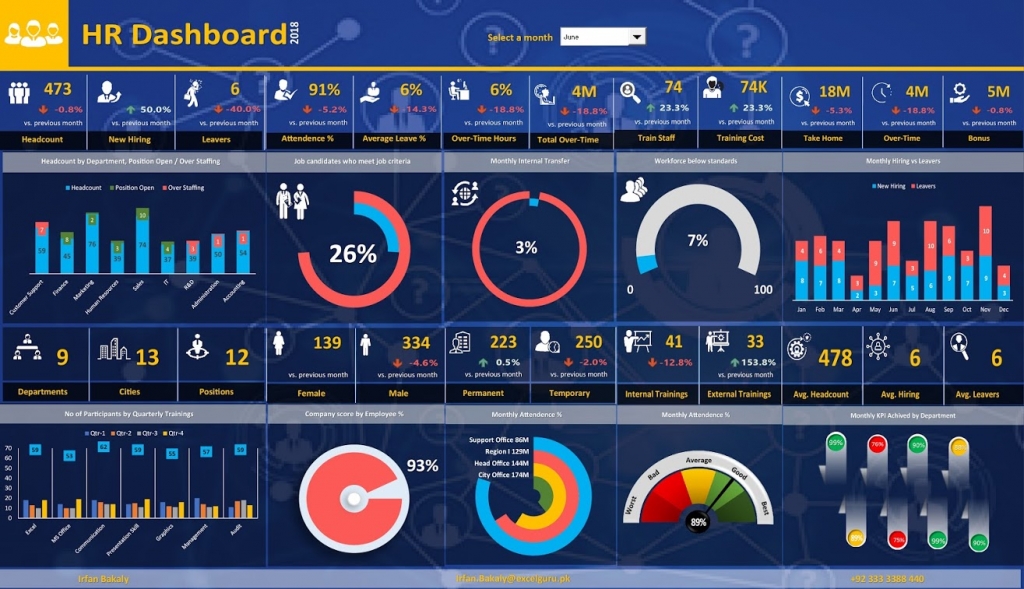
Advanced Excel and dashboard designing involves the use of complex formulas, functions, and data manipulation techniques to create dynamic, interactive, and visually appealing dashboards and reports. This includes the use of pivot tables, charts, graphs, slicers, and other advanced features to analyze and present data in a clear and concise manner. It also involves the use of various tools and techniques, such as macros, VBA programming, and Power Query, to automate and streamline the data processing process. In addition, advanced Excel and dashboard designing requires a strong understanding of data visualization principles and an eye for design to create visually appealing and effective dashboards that effectively communicate key insights and trends.
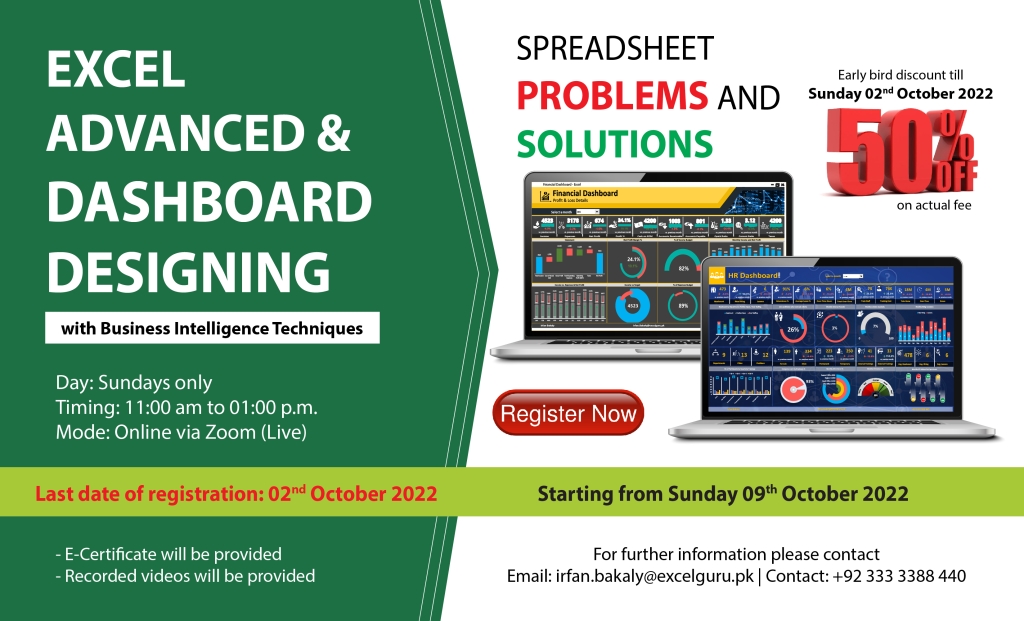
Excel Advanced & Dashboard Designing
Course Duration & Payment Details
Day: Sundays Only
Timing: 11:00am to 01:00pm
Duration: 16 Hours (8 weeks)
Starting from: Sunday 9th October 2022
Last date of registration: Sunday 2nd October 2022
Actual Fee: 18000/- | Early bird discount: 9000/-
How to Pay: Online Payment
Bank: Habib Bank Limited
Title: Irfan
Account No: 0011557900292501 | PK02HABB0011557900292501
Training Outline
- Data Analysis Basics
- Analyzing & Extracting Data with Filters & Advance Filter (Splitting data into Multiple Sheets)
- Sort / Advance Sort – (Dynamic Sorting)
- Finding and Removing Duplicates
- Analyzing Data within Lists & Tables
- Learn Core Data Analysis Functions
- Mathematical Functions (SUM, MAX, MIN, COUNT, COUNTA, AVERAGE)
- Understanding Logical Functions (IF)
- Lookup & Reference Functions Revisited and made subsets of data
- A step ahead with VLOOKUP; Simple VLOOKUP, Multi-worksheet, Multi-list, Nested VLOOKUP
- Understanding HLOOKUP
- MATCH / INDEX as a universal replacement to VLOOKUP
- Working with Date & Time Functions
- Working with Multiple Worksheets & Workbooks (Links)
- Applying Security to Files, Workbooks & Worksheets
- Working with Name Manager
- Data Analysis and PivotTable Reporting (20 Useful Daily routine Tasks)
- Creating a Pivot Table
- Formatting a Pivot Table
- Sorting Filtering Pivot Tables
- Adding Removing Fields from Pivot Tables
- Applying different styles to Pivot Table Fields
- Creating Pivot Charts
- Analyzing Data with PivotTable
- Working with Using Slicers
- Visual Analysis of Data using Charts
- Creating Advanced Charts
- Dynamic Charts with Form Controls
- Creating Dynamic & Advanced Dashboard
- Business Reporting where Dashboard fits in it
- Understanding Different Types of Dashboard Reports
- Typical Business Dashboard Components
- Representing your data on Dashboard
- Conditional Formatting
- How to use conditional formatting to highlight the top and bottom values
- How to use conditional formatting to mark values that are above or below average.
- How to use conditional formatting to create in-cell data bars.
- How to use color scales with conditional formatting.
- How to apply conditional formatting with icons.
- How to highlight specific & duplicate values with conditional formatting.
- Update and Refresh Connection
- Excel Macros
- Recording Macros to automatic repetitive tasks
- Editing Recorded Macros
- Excel’s Built-In Data Analysis Tools
- Intro to What if? Analysis
- Data Tables
- Scenarios
- Goal Seek
- Using Sparklines
- Introduction to Power Query
- Extracting, transforming, and loading data
- Converting data formats using Power Query steps
- Common Data Import Sources
- Working with CSV; Text; Excel Files
- Importing multiple files
- Working with Folders and Multiple Files
- Combining Data from Multiple Files
- Loading Data into a Worksheet
- Loading Data into the Excel Data Model
- Power Query and Table Relationships