
Data is the currency of the digital age, and those who can harness its power are in high demand. Join us on our two exciting journeys into the world of Power BI (Data Analysis, Forecasting, and Effective Reports) and Excel BI + AI (Advanced Data Analysis, BI, and Dashboard Design). Equip yourself with the skills that can drive informed decisions, spur business growth, and open up new career opportunities.
Power BI & Excel BI + AI
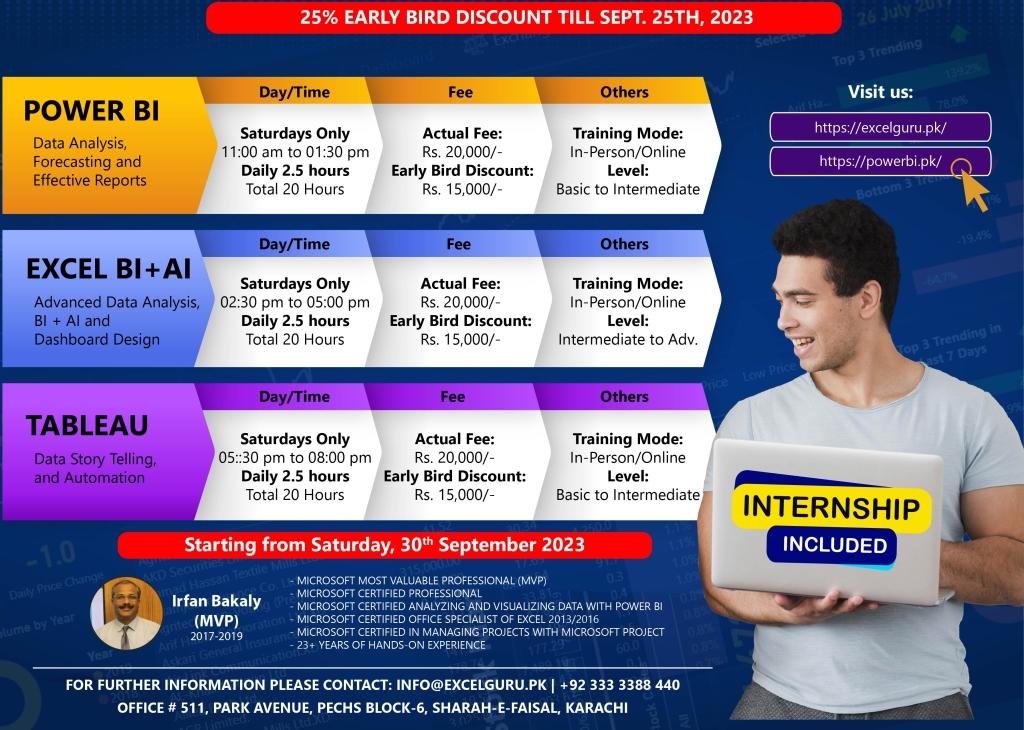
Training Title: Power BI (Data Analysis, Forecasting and Effective Reports)
Day: Saturdays only
Timing: 11:00 am to 01:30 pm
Duration: 20 hours
Starting from: Saturday, 30 September 2023
Last date of registration: Monday, 25 September 2023
Actual Fee: 20,000/- | Early bird discount: 15,000/-
How to Pay: Online Payment
Bank: Habib Bank Limited
Title: Irfan
Account No: 11557900292501 | PK02HABB0011557900292501
Training Title: Excel BI + AI (Advanced Data Analysis, BI, and Dashboard Design)
Day: Saturdays only
Timing: 02:30 pm to 05:00 pm
Duration: 20 hours
Starting from: Saturday, 30 September 2023
Last date of registration: Monday, 25 September 2023
Actual Fee: 20,000/- | Early bird discount: 15,000/-
How to Pay: Online Payment
Bank: Habib Bank Limited
Title: Irfan
Account No: 11557900292501 | PK02HABB0011557900292501
Those who are interested in physical classes, please join us at: Office # 511, Park Avenue, PECHS Block-6, Sharah-e-Faisal, Karachi.
Training Highlights
Training Title: Power BI (Data Analysis, Forecasting and Effective Reports)
Level: Basic to Intermediate
Getting started with Power BI
- Overview of Power BI
- Different products of Power BI
- Power BI pros and cons
- Other self-service BI tools and comparison
Objective 1: Connect & Transform the Raw Data
- Prepare Data for Exploration
- Process Data from Dirty to Clean
- Explanation of ETL process (Extraction – Transformation – Loading)
- Intro to the Power BI Query Editor
- Common Data Import Sources
- Working with CSV; Text; Excel Files, SQL
- Importing multiple files from multiple sources
- Importing data from Google sheets
- DirectQuery vs Import Data
- Basic Table Transformations
- Merge and Append queries
- Connecting to Folders
- Text, Number & Date Tools
- Index & Conditional Columns
- Grouping & Aggregating Data
- Pivoting & Unpivoting
- Modifying, Merging & Appending Queries
- Duplicate and Error Values
- Parameters for Loading only Required Data
- Working with Date Table
Objective 2: Build a Relational Data Model
- Intro to Database Normalization
- Data (“Fact”) Tables vs. Lookup (“Dimension”) Tables
- Creating Power BI Table Relationships
- Active vs. Inactive Relationships
- Data Modeling & Power BI Best Practices
Objective 3: Add Calculated Fields with DAX
- Intro to Data Analysis Expressions (DAX)
- Calculated Columns vs. Measures
- Row Context vs. Filter Context in Power BI
- Common Power BI Functions
- DAX & Power BI Best Practices
Objective 4: Design Interactive Power BI Reports
- Intro to the Power BI Report View
- Select the Right Visuals
- Adding Basic Charts to Power BI Reports
- Interaction of Visuals
- Inserting shapes, images, and text boxes
- Formatting & Filtering Options
- Setting Sort Order
- Table and Matrix Visuals
- Slicers & Timelines
- Cards & KPIs
- Power BI Map Visuals
- Tooltips
- Treemaps, Lines, Areas & Gauges
- Editing Report interactions
- Drill Down/Up
- Adding Drill through Filters
- Linking to Report Bookmarks and Hyperlinks
- Conditional Formatting
- Managing & Viewing Roles
- Creating an Interactive Business Intelligence Report
- Incorporate Layouts, Colours, and Themes
- Data Story Telling
- Creating Bins and Distributions for Balance
Objective 5: Power BI Service
- Publishing and Sharing reports/dashboards
- Frequent Updates and Changes
Training Title: Excel BI + AI (Advanced Data Analysis, BI, and Dashboard
Level: Intermediate to Advanced
- Objective 1: 10 Tricks that can make anyone an Excel expert
- Make Flash Fill magic
- Input Restriction with Data Validation Function
- Fast Navigation with Ctrl + Arrow Button
- Transpose Data from a Row to a column
- Compose text with &
- Input Values Starting with 0
- Remove Duplicates
- Text to Columns
- Fill Handle
- Auto Sum Alt + =
- Objective 2:Data Analysis Techniques
- Analyzing and extracting data with Filters & advanced filters (Splitting data into Multiple Sheets)
- Sort / Advance Sort – (Dynamic Sorting)
- Objective 3: Complex Functions make life easy
- Quick discussion: Sum, Min, Max, Count, CountA, Average
- SumIF, CountIF, AverageIF, Vlookup, Hlookup XLookup, Multi-Vlookup, Index, Match, Subtotal, NetworkDays.Intl., IF, OR, AND etc.
- Objective 4: Working with Multiple Worksheets and workbooks (Links)
- Working with Linked Workbooks
- Consolidating between sheets
- Using the Auto Consolidation Option of Excel
- Objective 5: Applying Security to Files, Workbooks & Worksheets
- Saving Files
- Save as type, Password
- Workbook Password Protection
- Cell Protection
- Worksheet Protection
- What Are Shared Workbooks?
- Saving Files
- Objective 6: Excel’s Built-In Data Analysis Tools
- Intro to What if? Analysis
- Scenarios
- Goal Seek
- Objective 7: Conditional Formatting
- Objective 8: Data Validation Techniques
- Objective 9: Excel with AI
- How AI Excel Tools Work in Your Spreadsheets
- Use AI Add-ins
- Data Analysis with Excel
- Dynamic reports and suggested charts
- Forecasting in Excel
- ChatGPT and Excel
- Objective 10: Working with Excel BI (Power Query and PowerPivot)
- Create and Edit a simple query
- Transforming and Cleaning Data
- Large data handling
- Working multiple Excel, CSV, TXT files
- Working with Folders and Multiple Files
- Append and Merge
- Loading Data into a Worksheet
- Working with Data Modeling
- Relationship with multi-tables
- Common DAX Functions
- Objective 11: Data Analysis using Pivot Table and Pivot Charts
- Use multiple Pivot Tables and Pivot Charts.
- Dynamic Charts using Pivot Table
- Explore the power of grouping in Pivot Tables.
- Connect multiple slicers to the Pivot Tables.
- Use formulas to aggregate the data as an alternative to Pivot Tables for more flexible reporting layouts.
- Using PivotTables to turn raw data into clear information that supports key decisions
- Dynamic highlight using Conditional Formatting
- Pivot Table Options including show/hide totals, error/empty cell display options, and refresh when opening the workbook (and more).
- Working with Slicers and Timeline
- Objective 12: Dynamic reports and dashboard