logo-mini

Excel Advanced Dashboard

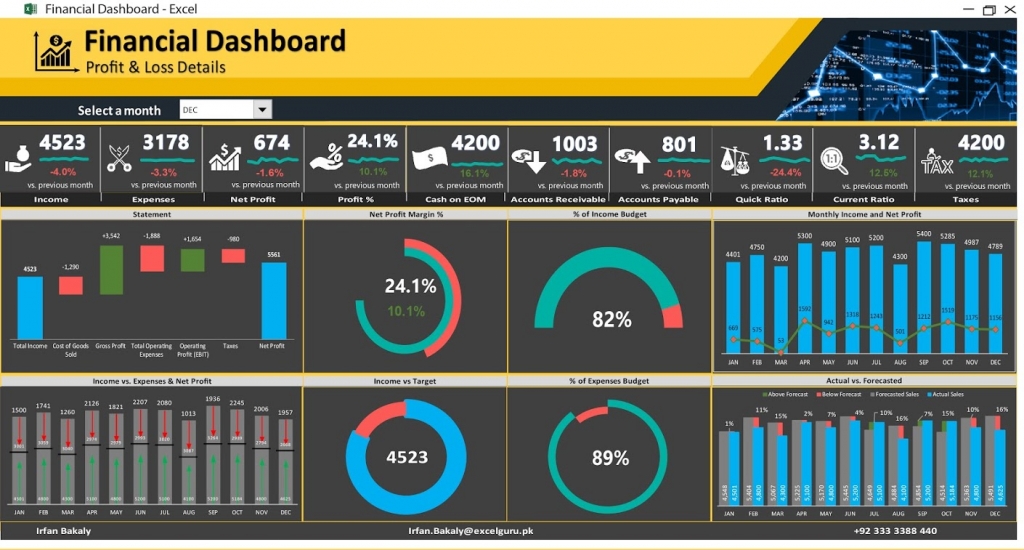
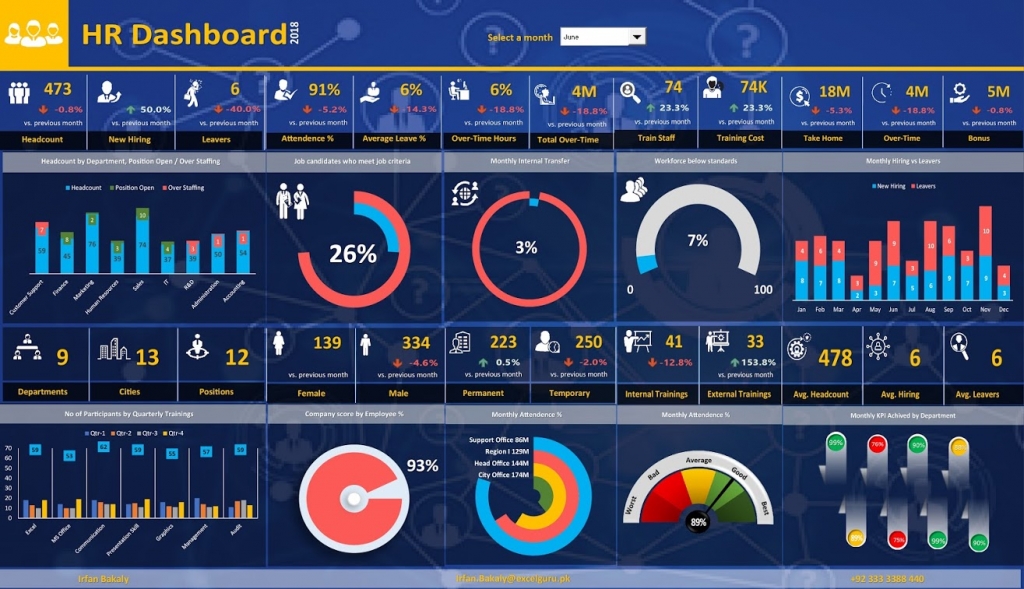
Dashboards track KPIs, metrics, and other data points in one visual, central place. They give you a high-level view of work, helping you make quick decisions and keeping everyone up to date. A dashboard’s visual nature simplifies complex data and provides an at-a-glance view of current status or performance in real time.

Dashboards are made up of tables, charts, gauges, and numbers. They can be used in any industry, for almost any purpose. For example, you could make a project dashboard, financial dashboard, sales dashboard, HR dashboard, marketing dashboard, and more.

Click on the image & download the sample file

Course Duration & Payment Details

Days: Saturday & Sunday
Timing: 07:00 to 09:30pm
Duration: 20 hours
Starting from: Saturday, 09 January 2021
Last date of registration: Thursday, 31 December 2020

Actual Fee: 18000/-  | Early bird discount: 9000/-
How to Pay: Online Payment
Bank: Habib Bank Limited
Title: Irfan
Account No: 0011557900292501 | PK02HABB0011557900292501

Training Outline

Introduction to Excel Dashboard
  • Useful Excel Keyboard Shortcuts
  • Time Saving Tips for Excel
  • Proper Spreadsheet Architecture & Workflow
  • Report Design Principles
  • Dashboard Source Data & Formats
  • Preparing the Data Using Format as Table
  • Custom Number Formatting
Excel Formulas You'll Need for Impressive Dashboards
  • Looking up Data with Excel Vlookup Functions
  • Index Match for Complex Lookups
  • Index for Dynamic Drop-down list Selection
  • Index for Dependent Drop-down list in Excel
  • SUMIF, COUNTIFS, AVERAGEIFS to Handle Multiple Criteria
  • LARGE and SMALL for Sorting Excel Data
  • ROW(S), COLUMN(S) for Indexing
  • CHOOSE for Flexibility
  • Excel Text Functions for Formatting
  • INDIRECT for Flexible Reference in Excel
  • Name Manager for Flexible Ranges
  • In-Cell Charts & Rept Function
  • Logical Function – IF, AND, OR
Form Controls for Interactive Excel Dashboards
  • Introduction to Form Controls – Active X vs. Form Controls
  • Combo Box – Select From a Drop Down List in Excel
  • Check Box – Check / Uncheck Option in Excel
  • Spin Button – Move Up & Down Lists in Excel
  • Option Button – Choose One Option Only
  • List Box – Select From a List of Options in Excel
  • Scroll Bar – Scroll Through Excel Graphs & Tables
  • Dependent Combo Boxes (2nd list automatically resets)
KPI Excel Dashboard
Slicer in Excel Dashboard
Conditional Formatting
Sparklines and Win/Loss Charts
Advanced Excel Chart Techniques
  • Chart Overview & When to Use Which Excel Graph
  • Excel Chart Basics (for those who need to get familiar with basic features)
  • Advanced Charting and Formatting Tips
  • Add Total Values to Stacked Excel Column Charts
  • Add Dynamic Series Labels Inside Excel Charts
  • Error Bars for Additional Control
  • Changing Chart Ranges
  • Info-graphics in Excel: Non-standard but Impressive Bar Chart
  • Camera Tool
  • Funnel Charts
  • Panel Charts
  • Bullet Chart
  • BI-Directional Bar Chart – Comparing Data
  • Thermometer Chart – Measuring Performance
  • Waterfall Chart for Cash Flow
  • Variances with Bar Chart
  • Pareto Chart 80-20 rule
  • Gantt Chart
Dashboard Design Principles
  • Design Principles & Tips
  • Dashboard Creation Process
  • Color Tips & Layouts
  • Building an Effective Data Model
Pivot Table Techniques
  • Why Use PivotTables
  • Variances in Excel Pivot Table
  • Pivot Table as Part of Excel Dashboard and Reports
  • Pivot Charts in Excel Dashboard
  • Automatically Refresh Excel Pivot Table with Simple VBA Code
Data Security and Password Protection

More Advanced Security using Excel Macros
Click on the image & download the sample file