
Power BI with Python is a powerful combination that allows users to leverage the strengths of both tools in their data analysis and visualization processes. Power BI provides a user-friendly interface and a wide range of visualizations, while Python offers advanced data manipulation and analysis capabilities. By using Python within Power BI, users can import and manipulate data, create custom visualizations, and even build custom dashboard widgets. Additionally, Python allows users to connect to various data sources, such as databases, APIs, and web scraping tools, giving them access to a vast amount of data. Overall, Power BI with Python allows users to take their data analysis and visualization to new heights, making it an invaluable tool for businesses and organizations of all sizes.
Power BI with Python
Course Duration & Payment Details
Days: Saturday and Sunday only
Timing: 08:00 to 10:00pm
Duration: 24 hours
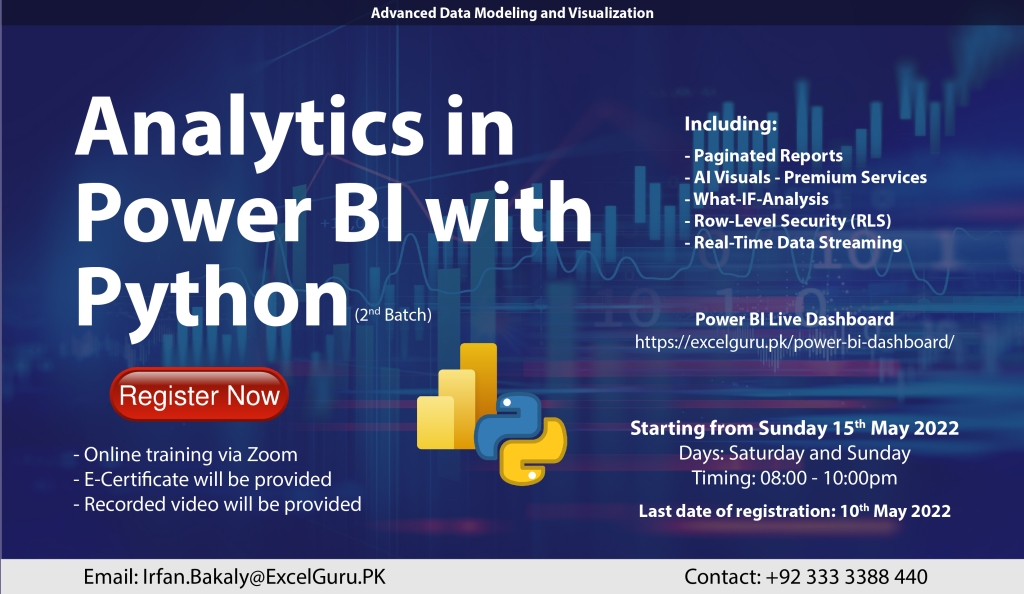
Starting from: Sunday, 15 May 2022
Last date of registration: Tuesday, 10 May 2022
Actual Fee: 20,000/- | Early bird discount: 10,000/-
How to Pay: Online Payment
Bank: Habib Bank Limited
Title: Irfan
Account No: 11557900292501 | PK02HABB0011557900292501
Training Highlights
Getting started
- What is BI?
- What is Self Service BI and the steps involved?
- Overview of Power BI
- Different products of Power BI
- Power BI licensing and features
- Power BI pros and cons
- Other self-service BI tools and comparison
Data Visualization in Power BI Desktop
- Visualization Best Practices
- Which Chart is the Best?
- Basic Charts
- Interaction of Visuals
- Color Formatting
- Setting Sort Order
- Dynamic Tooltips in visualizations
- Slicers & Timeline Slicers
- Cross Filtering and Highlighting
- Visual, Page, and Report Level Filters
- Drill Down/Up & Drill Through
- Hierarchies
- KPI Visuals
- Working with Map Visuals
- Table and Matrix with Conditional Formatting
- Multiple levels of filters
- Using custom slicers
- Switch between web/phone layout
- Inserting shapes, images, and text boxes
- Hyperlink & Bookmark
- Using interactive buttons
- The Key Influencers Visual
- Artificial Intelligence (AI) Visuals
- Working with Custom Visuals
Data Transformation / Edit Queries
- What is Power Query?
- Basic Transformations
- Get Data from SQL, CSV, TXT, Excel & Web
Combine Queries
- Merge, Joining queries
- Append, creating a big list
- Combine Binaries; Looping through files in a folder
Transformations
- Column Operations
- Row Operations
- Filtering & Sorting
- Group By
- Transpose
- Pivot, Unpivot
- Split & Merge
- Date Transformations (Year, Month, Quarter)
- Extending Fiscal Date Column
- Aggregate
- Add Custom Column
Power Query Formula Language: M
- What is M? and the importance of learning M
- M Syntax
- Examples of M
Working with AI (Premium Services) Visuals
Data Modeling
- Introduction to relationship view navigation
- Understanding data modeling concepts
- Creating and editing relationships
- Why is a data model more efficient?
- Relationship-based on multiple Columns
- Cardinality: Many-to-One & One-to-One & One-to-Many
- Understanding how LEFT, RIGHT, INNER, and OUTER joins work
- Cross Filter Direction & Many-to-Many
- Managing Active vs. Inactive Relationships
Date & Time Functions – Calendar, CalendarAuto, Date, Day, Month, Year, Format, Datediff, Now, Today, Weekday, Weeknum
Filter Functions – All, AllExcept, AllSelected, Calculate, Filter, HasOneValue, Related
Logical Functions – IF, Switch
Time Intelligence Expressions – MTD, QTD, YTD, Running Total
Statistical Function – Average, AverageX, Count, CountA, CountBlank, CountRows, CountX, Max, MaxX, Min, RankX, Sumarize
- Top N Values, Top N Filter, Top Order calculations, Top 10 Customers, Dynamic
Power BI service
- What are workspaces?
- Difference between datasets, workbooks, reports, and dashboards
- Publishing data to web
- Pinning visuals and creating dashboards
- Viewing reports & dashboards
- Sharing reports & dashboards
- Row-level security
Gateways
- What is Gateway?
- Types of Gateway
- On-premises Gateway in Details
- Installation, Configuration, and considerations
- Schedule Refresh
Paginated Reports
- What is Paginated Report in Power BI
- When to use Paginated Report?
- Prerequisites and Tools needed to get started
- Create Power BI Premium Workspace
- Interface of Power BI Report Builder
- Connect SQL Data source in Power BI Paginated Report
- Create the first report on Report Builder
- Publish to Power BI Service
- Install Data Gateway
- Manage Gateway
Creating the live streaming dataset in Power BI
Working with Python Visuals in Power BI
- Installation Anaconda
- Data Frame Functions
- Enabling Python in Power BI
- Importing data using a Python Script
- Working with Python libraries – Pandas & Matplotlib
- Working with variables
- Using a Python script to Create Visualizations in Power BI