A financial dashboard in Power BI is a visual representation of key financial metrics and data for a business. It allows users to quickly and easily see how their company is performing financially, including revenue, expenses, profitability, and cash flow. The dashboard can include various charts, graphs, and tables to help users understand the data and make informed decisions. Some examples of financial metrics that may be included on a financial dashboard in Power BI include sales, net income, operating expenses, gross margin, and return on investment. The dashboard can also be customized to include specific financial data that is important to the business. Overall, a financial dashboard in Power BI is an essential tool for managing and monitoring the financial health of a company.
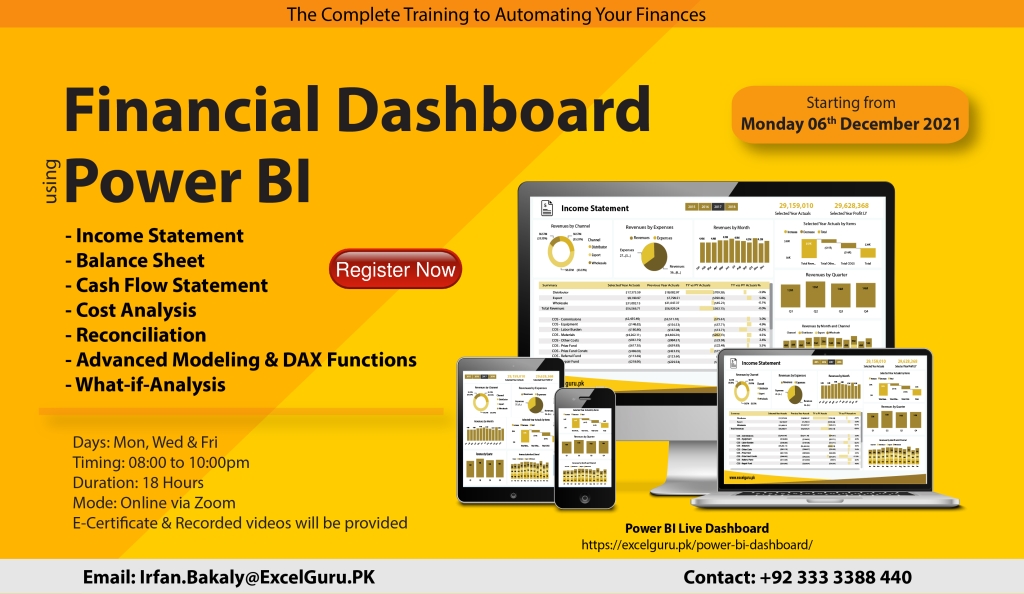
Financial Dashboard
Course Duration & Payment Details
Days: Monday, Wednesday & Friday
Timing: 08:00 to 10:00pm
Duration: 18 hours
Starting from: Monday, 06 December 2021
Last date of registration: Wednesday, 01 December 2021
Actual Fee: 18000/- | Early bird discount: 9000/-
How to Pay: Online Payment
Bank: Habib Bank Limited (26 street, Badar Commercial, DHA Karachi)
Title: Irfan
Account No: 0011557900292501 | PK02HABB0011557900292501
Training Highlights
Data Visualization in Power BI Desktop
- Visualization Best Practices
- Which Chart is the Best?
- Basic Charts
- Interaction of Visuals
- Color Formatting
- Setting Sort Order
- Tooltips
- Slicers & Timeline Slicers
- Cross Filtering and Highlighting
- Visual, Page, and Report Level Filters
- Hierarchies
- Line Chart
- Table and Matrix with Conditional Formatting
- Multiple levels of filters
- Using custom slicers
- Inserting shapes, images, and text boxes
- Drill Down
- Hyperlink & Bookmark
Query Editor
- Base structures in Power Query
- Query Editor in Details
- Get Data from Excel
Power Query Syntax
- Data Types in Power Query
- Transformation Steps
- Query Operations; Duplicate, and Reference
- Managing Queries in Groups
Combine Queries
- Merge, Joining queries
- Append, creating a big list
Transformations
- Column Operations
- Row Operations
- Filtering
- Sorting
- Group By
- Transpose
- Pivot, Unpivot
- Split
- Merge (Concatenate)
Power Query Formula Language: M
- What is M? and the importance of learning M
- M Syntax
- Basic examples of M
Power BI desktop – data modeling
- Introduction to relationship view navigation
- Understanding data modeling concepts
- Creating and editing relationships
- Why is a data model more efficient?
- Relationship-based on multiple Columns
- Principles of Database Normalization
- Cardinality: Many-to-One & One-to-One
- Understanding how LEFT, RIGHT, INNER, and OUTER joins work
- Cross Filter Direction & Many-to-Many
- Understanding Active Properties
- M-Language vs DAX (Data Analysis Expressions)
- Understanding the CALENDAR Function
- Managing Active vs. Inactive Relationships
Working with DAX Functions
- Introduction to DAX
- Syntax of DAX
- Understanding calculated columns and measures
- Why is a measure more efficient than a column?
- Creating calculated columns
- Measures in PowerPivot
- Implicit and explicit measures
- Understanding filter context
- Measure referencing
- Editing / Deleting measures
- Logical Operations
Working with DAX Functions
- SUM, SUMX, SUMMARIZE, MIN, MINX, MAX, MAXX, COUNT, AVERAGE, AVERAGEX, UNION, SAMEPERIODLASTYEAR, YTD, QTD, MTD, DATEADD, CALCULATE, FILTER, IF, SELECTEDVALUE, DIVIDE, FORMAT, ABS, TREATAS, SWITCH, VALUES, BLANK, COUNTROWS
Working with Variable and Comments
What-If- Analysis
- New Parameter
Power BI service
- Logging in and understanding navigation
- What are workspaces?
- Difference between datasets, workbooks, reports, and dashboards
- Publishing data to web
Power BI Service – Dashboards
- Viewing reports & dashboards
- Sharing reports & dashboards
Integration
- Power BI and PowerPoint