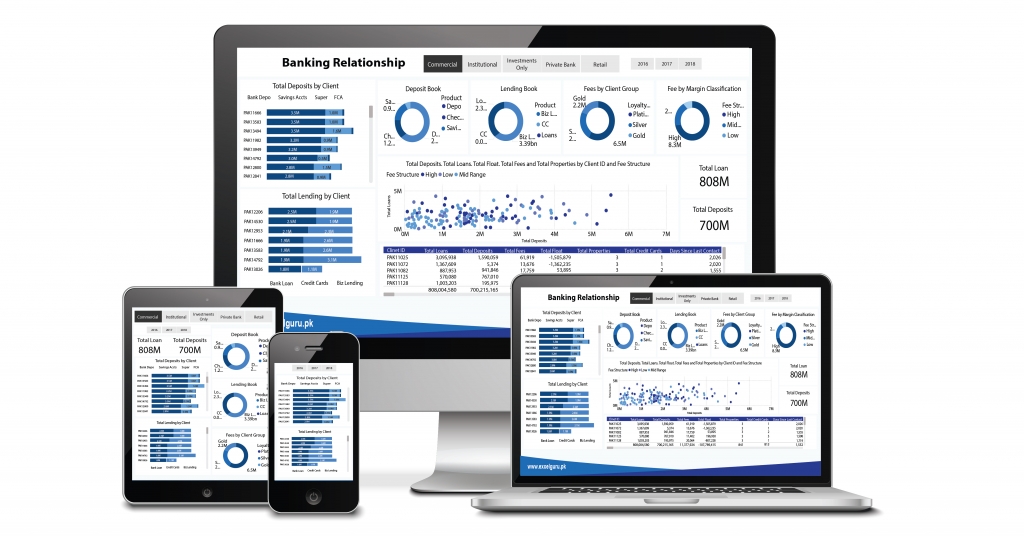

A banking business intelligence dashboard is an analytical display tool that’s linked to different banking data sets across multiple systems. Those systems include but are not limited to: the bank’s core banking platform, CRMs, loan-processing software, and any other type of banking data warehouse.
Banking dashboards are used to visually track and display banking KPIs (those are key performance indicators; more on them in a minute). They also track banking business process results, customer trends, financial performance… pretty much anything you want to track, so long as you’ve got the data to crunch. Banking executive dashboards help you look back, to see historical trends in, say, consumer or commercial lending. They can also, to an extent, let you peer into the future, via predictive analytics.