SALES ANALYTICS DASHBOARD
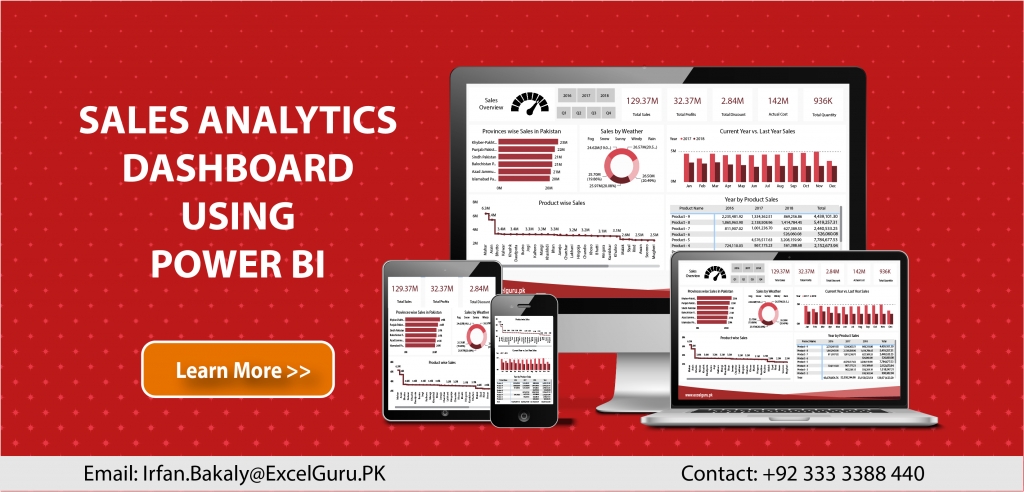
In our dashboard, you will see the below mention information
- Number of deals in the pipeline
- Win rate
- Average deal size
- Average time to close
- Sales revenue
- Sales forecast accuracy
- Lead response time
- Follow-up rate
- Activity Sales Metrics
- Pipeline Sales Metrics
- Lead Generation Sales Metrics
- Sales Outreach Metrics
- Primary Conversion Sales Metrics
- Channel Sales Metrics
- Sales Productivity Metrics
- Rep Hiring and Onboarding Metrics
- Sales Process, Tool, and Training Adoption Metrics
Try the live demo below
Click to see some other dashboard
Financial Dashboard
HR Analytics Dashboard
Power BI Training Outline
Theory Time:
- What is a data warehouse
- Concept of ETL
- Data warehouse Characteristics
- Data warehouse Schema
- What is CRM – Customer Relationship Management
- Dynamic 365 – CRM
- The Star Schema
- Snowflake schemas in Power BI
Getting started
- What is BI?
- What are Self Service BI and the steps involved?
- Overview of Power BI
- Different products of Power BI
- Power BI licensing and features
- Power BI pros and cons
- Other self-service BI tools and comparison
Power BI desktop – overview
- Navigation
- Introduction to core functions and practical significance
- Overview of the steps and languages involved
Power BI desktop – data extraction
- Exploring different data sources and connectors
- Data extraction from the Web
- Data extraction from Access Database
- Data extraction from Online Services
- Data extraction from Excel Workbook
Data Visualization in Power BI Desktop
- Visualization Best Practices
- Which Chart is the Best?
- Basic Charts
- Interaction of Visuals
- Color Formatting
- Setting Sort Order
- Types of Charts & Play with Axis
- Tooltips
- Slicers & Timeline Slicers
- Cross Filtering and Highlighting
- Visual, Page and Report Level Filters
- Drill Down/Up
- Hierarchies
- Map Visuals
- Waterfall Chart; Cashflow
- Scatter Chart
- Line Chart
- Table and Matrix with Conditional Formatting
- Multiple levels of filters
- Using custom slicers
- Switch between web/phone layout
- Inserting shapes, images and text boxes
- Drill Down
- Tooltip
- Hyperlink & Bookmark
Working with Custom Visuals
Power BI desktop – data transformation / Edit Queries
- What is Power Query?
- Power Query in Excel and Power BI
- Basic Transformations
- Get Data
- Different Data Sources
- Get Data from Web
- Importing JSON Data
- Updated Star Wars API URL
- Setting up a MySQL Server
- Importing Data from a MySQL Server (and other SQL Servers)
Query Editor
- Base structures in Power Query
- Query Editor in Details
- Get Data from CSV Files
- Get Data from Excel
- Transformation Pane
Power Query Syntax
- Data Types in Power Query
- Query Properties
- Transformation Steps
- Query Operations; Duplicate, and Reference
- Managing Queries in Groups
Combine Queries
- Merge, Joining queries
- Append, creating a big list
- Combine Binaries; Looping through files in a folder
- Saving the Project Draft
- Fuzzy Lookup
Transformations
- Column Operations
- Row Operations
- Filtering
- Sorting
Table Transformations
- Group By
- Transpose
- Pivot, Unpivot
Text Transformations
- Split
- Merge (Concatenate)
More Transformations
- Date Transformations (Year, Month, Quarter)
- Extending Fiscal Date Column
- Time Transformations
- Aggregate
- Add Custom Column
- Add Conditional Columns (IF THEN ELSE)
Power Query Formula Language: M
- What is M? and the importance of learning M
- M Syntax
- Things to Consider for M Scripting
- Basic examples of M
- Values in M
- Logical Operations
Power BI desktop – data modeling
- Introduction to relationship view navigation
- Understanding data modeling concepts
- Creating and editing relationships
- Why is a data model more efficient?
- Relationship-based on multiple Columns
- Principles of Database Normalization
- Cardinality: Many-to-One & One-to-One
- Understanding how LEFT, RIGHT, INNER, and OUTER joins work
- Cross Filter Direction & Many-to-Many
- Understanding Active Properties
- M-Language vs DAX (Data Analysis Expressions)
- Understanding the CALENDAR Function
- Managing Active vs. Inactive Relationships
Introduction to DAX
- Introduction to DAX
- Syntax of DAX
- Understanding calculated columns and measures
- Why is a measure more efficient than a column?
- Creating calculated columns
- Measures in PowerPivot
- Implicit and explicit measures
- Understanding filter context
- Measure referencing
- Editing / Deleting measures
- Logical Operations
- Overview of Functions
Artificial Intelligence (AI) Visuals
- Q&A Visual
- Key Influencers Visual
- Decomposition Tree Visual
Most common and demanding DAX functions / Learning Data Analysis Expression (DAX) Functional language
Date & Time Functions – Calendar, CalendarAuto, Date, Day, Month, Year, Format, Datediff, Now, Today, Weekday, Weeknum
Filter Functions – All, AllExcept, AllSelected, Calculate, Earlier, Filter, HasOneValue, IsFiltered, Related
Math & Trig Functions – Ceiling, Divide, Round, Roundup, Sum, Sumx
Logical Functions – IF, AND, OR, Switch
Time Intelligence Expressions – MTD, QTD, YTD, SamePeriodLastYear, DateAdd, DatesBetween, Running Total
Statistical Function – Average, AverageX, Count, CountA, CountBlank, CountRows, CountX, Max, MaxX, Min, MinX, MedianX, RankX, Sumarize
Text Functions – Concatenate, Format, Left, Len, Lower, Rept, Right, Trim, Unichar, Upper, Value
- Top N Values, Top N Filter, Top Order calculations, Top 10 Customers, Dynamic
- Date Table, More Scenarios of Using Calculated Tables, Performance Consideration
Power BI service
- Logging in and understanding navigation
- What are workspaces?
- Difference between datasets, workbooks, reports, and dashboards
- How and where is the data stored?
- Gaining familiarity with various security concerns
- Publishing data to web
Power BI Service – Dashboards
- Pinning visuals and creating dashboards
- Alignment and configuration of visuals
- Adding tiles
- Viewing reports & dashboards
- Sharing reports & dashboards
- Understanding data governance
- Row-level security
- Role-playing dimension
Gateways
- What is Gateway?
- Types of Gateway
- On-premises Gateway in Details
- Installation, Configuration, and considerations
- Schedule Refresh
Integration
Power BI and PowerPoint