HR Analytics Dashboard
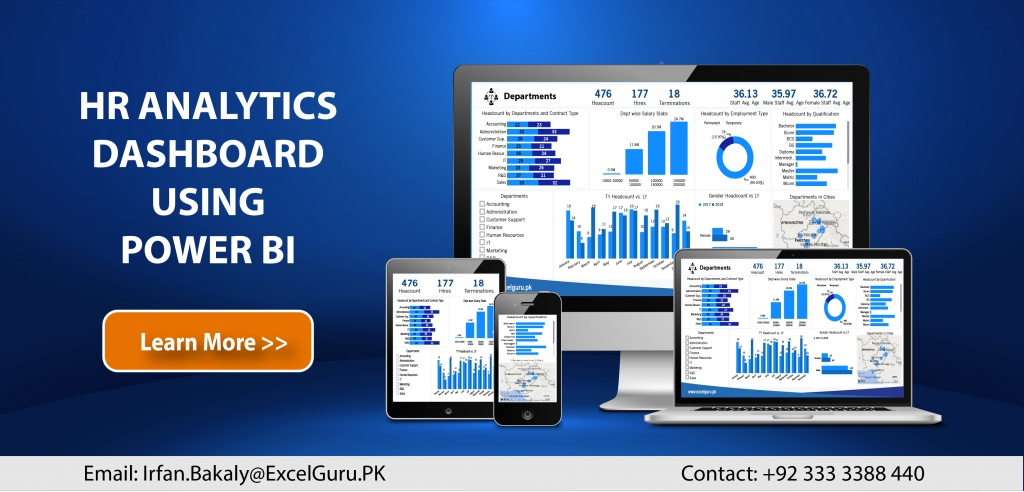
In our dashboard, you will see the below mention information
- Organization Structure
- Revenue per employee – Companies need to know if they are overstaffed/understaffed and this metric can determine if more is being spent on salaries than there is revenue coming in.
- Headcount: Track the size of your company or department
- Gender Ratio: Common distinction often used for diversity purposes
- Age: Age is becoming increasingly important in today’s aging workforce. Age is often a key focus point for organizations that want to innovate and reorganize.
- Education level: Educational level should only be included when available and when relevant for the overarching goals of the organization. Otherwise, it runs the risk of being a ‘vanity metric’ in the HR report.
- Function type: A metric like function type or function clusters might help to distinguish different groups within the company. An example could be top management, middle management, production personnel, and support staff.
- Cost per Hire: Measure how much it costs for a single hire
- Turnover Rate: Analyze the effectiveness of your employee retention efforts
- New hires: This metric represents the number and/or percentage of new employees who joined the organization within the last year.
- Absence: This metric represents the percentage of time that employees were absent in the previous period on average. Another representation of this number is the total days of absence per employee.
- Absence rate – How frequently are employees calling out for the day/week/month? And, is there a pattern in certain departments or absences by the time of year.
- Length of service – This can be an indicator of happiness at work and employee satisfaction. The more employees a company can retain, and the longer they can retain them, the better.
- Training cost: Training cost represents the total amount that a company spends on training new hires and the existing workforce.
- Recruitment cost: The total cost of recruitment efforts, often includes the costs of external agencies, advertisement and, sometimes, lost productivity. Entire books have been written on how to calculate this number. Read for more information here.
- Applications Received per Vacancy: Track the popularity of your job vacancy postings
Try the live demo below 
Click to see some other dashboard
Sales Analytics Dashboard
Financial Dashboard
Power BI Training Outline
Theory Time:
- What is a data warehouse
- Concept of ETL
- Data warehouse Characteristics
- Data warehouse Schema
- What is CRM – Customer Relationship Management
- Dynamic 365 – CRM
- The Star Schema
- Snowflake schemas in Power BI
Getting started
- What is BI?
- What are Self Service BI and the steps involved?
- Overview of Power BI
- Different products of Power BI
- Power BI licensing and features
- Power BI pros and cons
- Other self-service BI tools and comparison
Power BI desktop – overview
- Navigation
- Introduction to core functions and practical significance
- Overview of the steps and languages involved
Power BI desktop – data extraction
- Exploring different data sources and connectors
- Data extraction from the Web
- Data extraction from Access Database
- Data extraction from Online Services
- Data extraction from Excel Workbook
Data Visualization in Power BI Desktop
- Visualization Best Practices
- Which Chart is the Best?
- Basic Charts
- Interaction of Visuals
- Color Formatting
- Setting Sort Order
- Types of Charts & Play with Axis
- Tooltips
- Slicers & Timeline Slicers
- Cross Filtering and Highlighting
- Visual, Page and Report Level Filters
- Drill Down/Up
- Hierarchies
- Map Visuals
- Waterfall Chart; Cashflow
- Scatter Chart
- Line Chart
- Table and Matrix with Conditional Formatting
- Multiple levels of filters
- Using custom slicers
- Switch between web/phone layout
- Inserting shapes, images and text boxes
- Drill Down
- Tooltip
- Hyperlink & Bookmark
Working with Custom Visuals
Power BI desktop – data transformation / Edit Queries
- What is Power Query?
- Power Query in Excel and Power BI
- Basic Transformations
- Get Data
- Different Data Sources
- Get Data from Web
- Importing JSON Data
- Updated Star Wars API URL
- Setting up a MySQL Server
- Importing Data from a MySQL Server (and other SQL Servers)
Query Editor
- Base structures in Power Query
- Query Editor in Details
- Get Data from CSV Files
- Get Data from Excel
- Transformation Pane
Power Query Syntax
- Data Types in Power Query
- Query Properties
- Transformation Steps
- Query Operations; Duplicate, and Reference
- Managing Queries in Groups
Combine Queries
- Merge, Joining queries
- Append, creating a big list
- Combine Binaries; Looping through files in a folder
- Saving the Project Draft
- Fuzzy Lookup
Transformations
- Column Operations
- Row Operations
- Filtering
- Sorting
Table Transformations
- Group By
- Transpose
- Pivot, Unpivot
Text Transformations
- Split
- Merge (Concatenate)
More Transformations
- Date Transformations (Year, Month, Quarter)
- Extending Fiscal Date Column
- Time Transformations
- Aggregate
- Add Custom Column
- Add Conditional Columns (IF THEN ELSE)
Power Query Formula Language: M
- What is M? and the importance of learning M
- M Syntax
- Things to Consider for M Scripting
- Basic examples of M
- Values in M
- Logical Operations
Power BI desktop – data modeling
- Introduction to relationship view navigation
- Understanding data modeling concepts
- Creating and editing relationships
- Why is a data model more efficient?
- Relationship-based on multiple Columns
- Principles of Database Normalization
- Cardinality: Many-to-One & One-to-One
- Understanding how LEFT, RIGHT, INNER, and OUTER joins work
- Cross Filter Direction & Many-to-Many
- Understanding Active Properties
- M-Language vs DAX (Data Analysis Expressions)
- Understanding the CALENDAR Function
- Managing Active vs. Inactive Relationships
Introduction to DAX
- Introduction to DAX
- Syntax of DAX
- Understanding calculated columns and measures
- Why is a measure more efficient than a column?
- Creating calculated columns
- Measures in PowerPivot
- Implicit and explicit measures
- Understanding filter context
- Measure referencing
- Editing / Deleting measures
- Logical Operations
- Overview of Functions
Artificial Intelligence (AI) Visuals
- Q&A Visual
- Key Influencers Visual
- Decomposition Tree Visual
Most common and demanding DAX functions / Learning Data Analysis Expression (DAX) Functional language
Date & Time Functions – Calendar, CalendarAuto, Date, Day, Month, Year, Format, Datediff, Now, Today, Weekday, Weeknum
Filter Functions – All, AllExcept, AllSelected, Calculate, Earlier, Filter, HasOneValue, IsFiltered, Related
Math & Trig Functions – Ceiling, Divide, Round, Roundup, Sum, Sumx
Logical Functions – IF, AND, OR, Switch
Time Intelligence Expressions – MTD, QTD, YTD, SamePeriodLastYear, DateAdd, DatesBetween, Running Total
Statistical Function – Average, AverageX, Count, CountA, CountBlank, CountRows, CountX, Max, MaxX, Min, MinX, MedianX, RankX, Sumarize
Text Functions – Concatenate, Format, Left, Len, Lower, Rept, Right, Trim, Unichar, Upper, Value
- Top N Values, Top N Filter, Top Order calculations, Top 10 Customers, Dynamic
- Date Table, More Scenarios of Using Calculated Tables, Performance Consideration
Power BI service
- Logging in and understanding navigation
- What are workspaces?
- Difference between datasets, workbooks, reports, and dashboards
- How and where is the data stored?
- Gaining familiarity with various security concerns
- Publishing data to web
Power BI Service – Dashboards
- Pinning visuals and creating dashboards
- Alignment and configuration of visuals
- Adding tiles
- Viewing reports & dashboards
- Sharing reports & dashboards
- Understanding data governance
- Row-level security
- Role-playing dimension
Gateways
- What is Gateway?
- Types of Gateway
- On-premises Gateway in Details
- Installation, Configuration, and considerations
- Schedule Refresh
Integration
Power BI and PowerPoint