
Online registration form: https://forms.gle/9G9QWjYn3qFmsV3g9
Power BI & Tableau
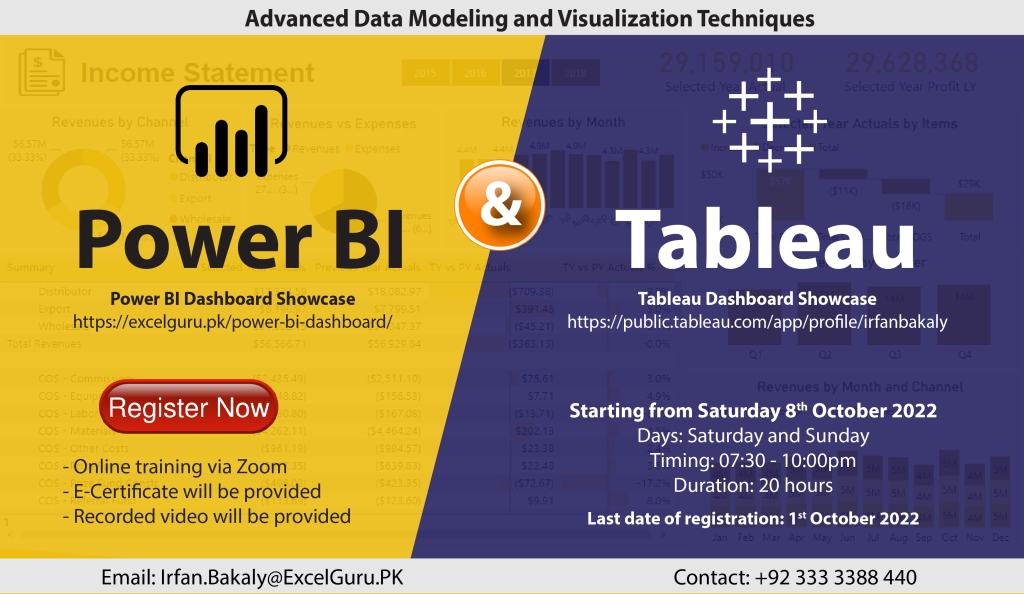
Days: Saturday and Sunday only
Timing: 07:30 to 10:00pm
Duration: 20 hours
Starting from: Saturday, 08 October 2022
Last date of registration: Saturday, 01 October 2022
Actual Fee: 20,000/- | Early bird discount: 15,000/-
How to Pay: Online Payment
Bank: Habib Bank Limited
Title: Irfan
Account No: 11557900292501 | PK02HABB0011557900292501
Training Highlights
Getting started with Power BI
- What is BI?
- Overview of Power BI
- Different products of Power BI
- Power BI pros and cons
- Other self-service BI tools and comparison
Objective 1: Connect & Transform the Raw Data
- Intro to the Power BI Query Editor
- Common Data Import Sources
- Working with CSV; Text; Excel Files, SQL
- Importing multiple files from multiple sources
- Importing data from Google sheets
- Basic Table Transformations
- Merge and Append queries
- Connecting to Folders
- Text, Number & Date Tools
- Index & Conditional Columns
- Grouping & Aggregating Data
- Pivoting & Unpivoting
- Modifying, Merging & Appending Queries
- Duplicate and Error Values
- Query Editing & Power BI Best Practices
- Working with Date Table
Objective 2: Build a Relational Data Model
- Intro to Database Normalization
- Data (“Fact”) Tables vs. Lookup (“Dimension”) Tables
- Creating Power BI Table Relationships
- “Star” vs. “Snowflake” Schemas
- Active vs. Inactive Relationships
- Relationship Cardinality
- Connecting Multiple Data Tables
- Filtering & Cross-Filtering
- Hiding Fields from the Power BI Report View
- Data Modeling & Power BI Best Practices
Objective 3: Add Calculated Fields with DAX
- Intro to Data Analysis Expressions (DAX)
- Calculated Columns vs. Measures
- Row Context vs. Filter Context in Power BI
- DAX Syntax & Operators
- Common Power BI Functions
- Logical & Conditional Statements
- Text, Math & Stats Functions
- Joining Data with RELATED
- CALCULATE, ALL & FILTER Functions
- Time Intelligence Formulas
- DAX & Power BI Best Practices
Objective 4: Design Interactive Power BI Reports
- Intro to the Power BI Report View
- Which Chart is the Best?
- Adding Basic Charts to Power BI Reports
- Interaction of Visuals
- Inserting shapes, images, and text boxes
- Formatting & Filtering Options
- Setting Sort Order
- Table and Matrix Visuals
- Slicers & Timelines
- Cards & KPIs
- Power BI Map Visuals
- Tooltips
- Treemaps, Lines, Areas & Gauges
- Editing Report interactions
- Drill Down/Up
- Adding Drill through Filters
- Linking to Report Bookmarks and Hyperlinks
- Conditional Formatting
- Using “What-If” Parameters
- Managing & Viewing Roles
- The Key Influencers Visual
- Artificial Intelligence (AI) Visuals
Objective 5: Power BI Service
- Publishing and Sharing reports/dashboards
- Working with RSL
- Schedule Refresh
Getting started with Tableau
- Install Tableau Desktop 2022
- Connect Tableau to various Datasets: Excel and CSV files
- Creating Visuals
- e.g Barcharts, Area Charts, Maps, Scatterplots, Piecharts, Treemaps
- Create Interactive Dashboards
- Create Storylines
- Understand Types of Joins and how they work
- Create Table Calculations
- Work with Parameters
- Create Dual Axis Charts
- Create Calculated Fields
- Work with Timeseries Data (two methods)
- Creating Data Extracts in Tableau
- Working with Formula and Functions
- Working with KPI
- Working Conditional Formatting
- Understand Aggregation, Granularity, and Level of Detail
- Adding Filters and Quick Filters
- Adding Actions to Dashboards (filters & highlighting)
- Refreshing Data